Cohort Application
The Cohort Application (CohortApp) module facilitates the exploration and construction of cohorts on experiments metadata and structured clinical data using standard ontologies such as the Human Phenotype Ontology (HPO_), the Orphanet Rare Disease Ontology (ORDO_) and Online Mendelian Inheritance in Man (OMIM_).
Below we explain how to use the application and how to create a cohort. If you have any questions, please contact our helpedesk via help@rd-connect.eu. For any feedback on this application, please contact alberto.corvo@cnag.crg.eu.
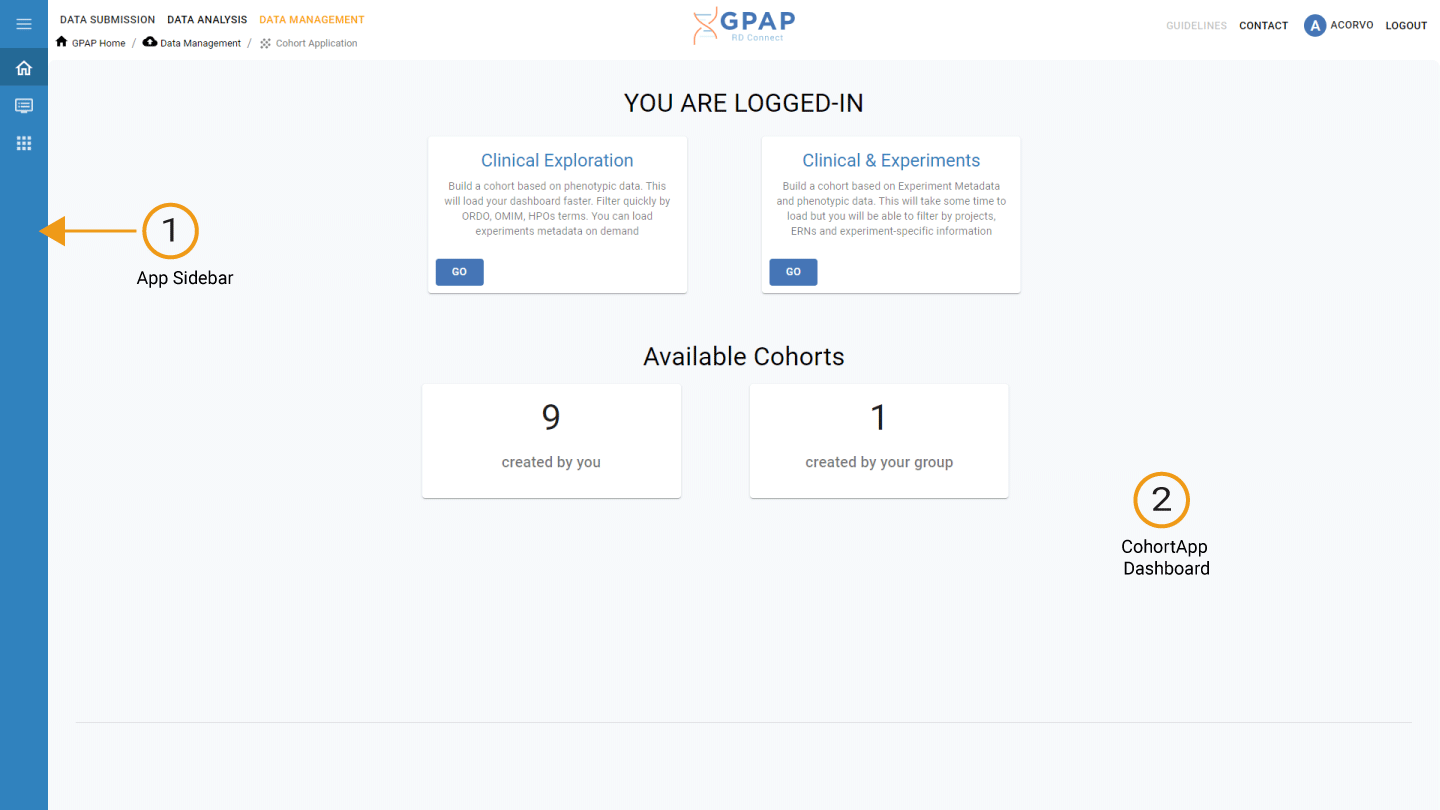
Left side-bar (1) - Side-bar to navigate the CohortApp Application
Personal Dashboard (2) - Your main dashboard when you enter the CohortApp. You can see previously saved cohorts by you or your group.
Views
The CohortApp is made of 4 main views:
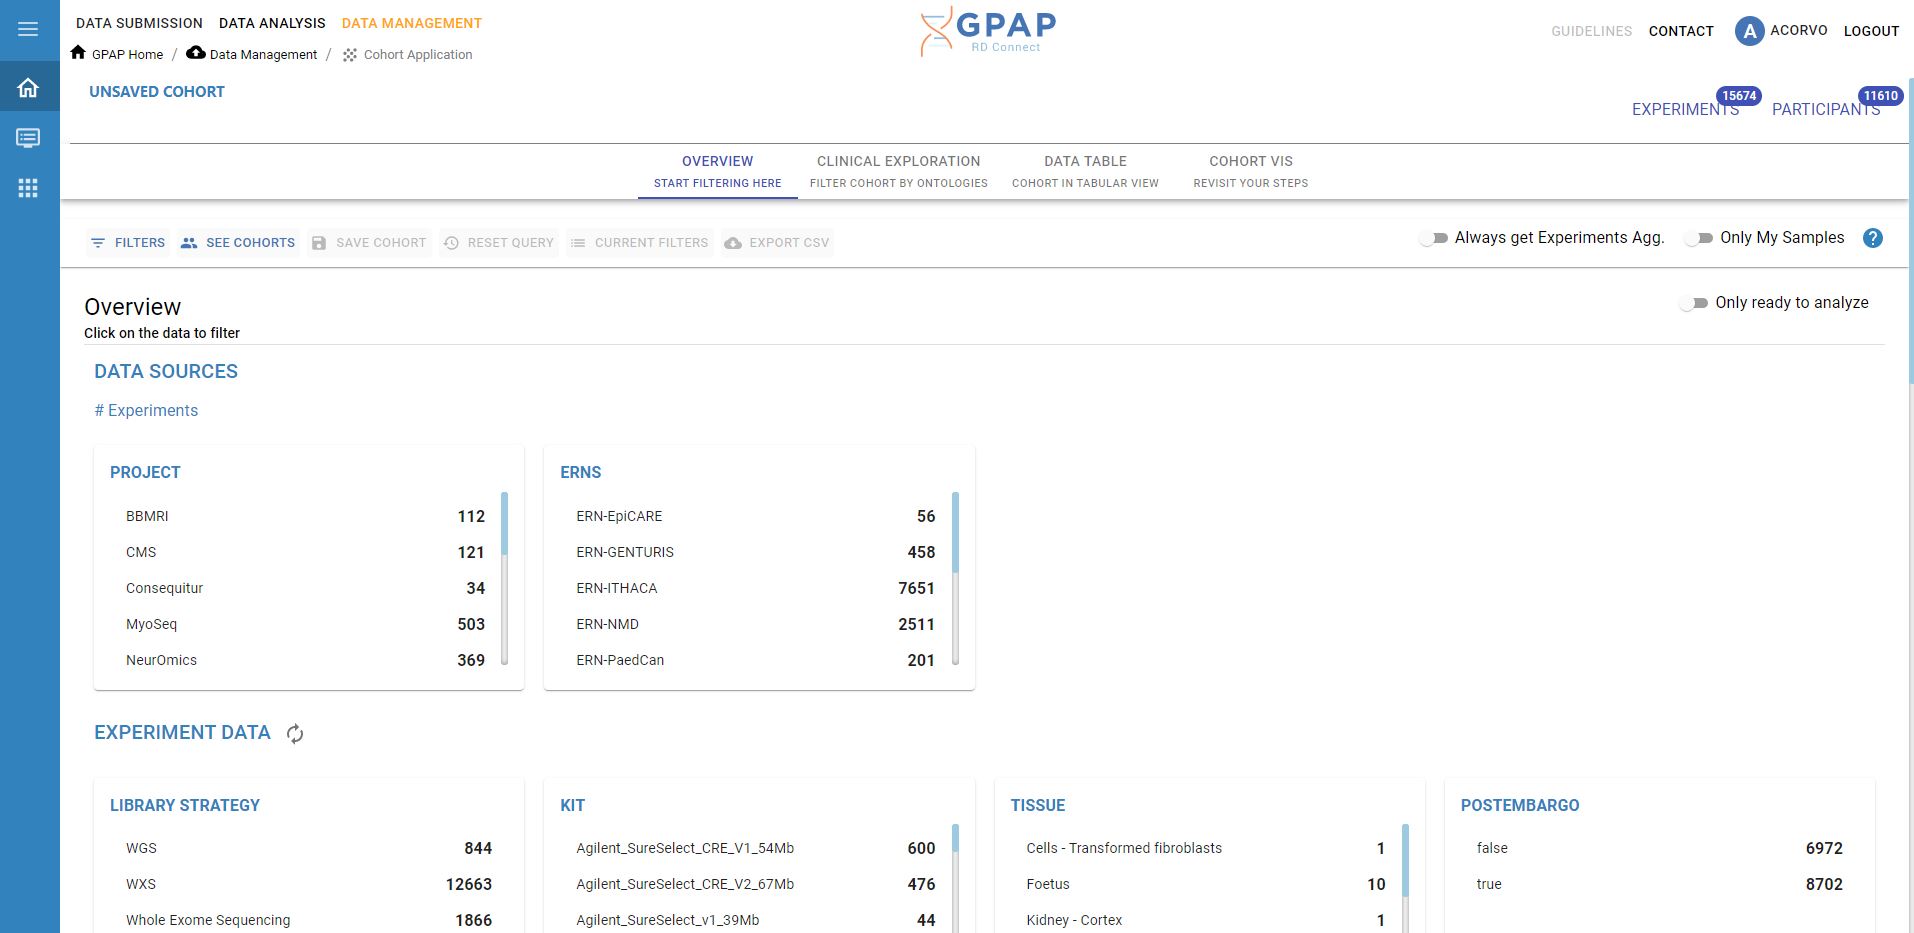
Overview: Where you can start filtering your experiments and participants by clicking on the aggregation items,
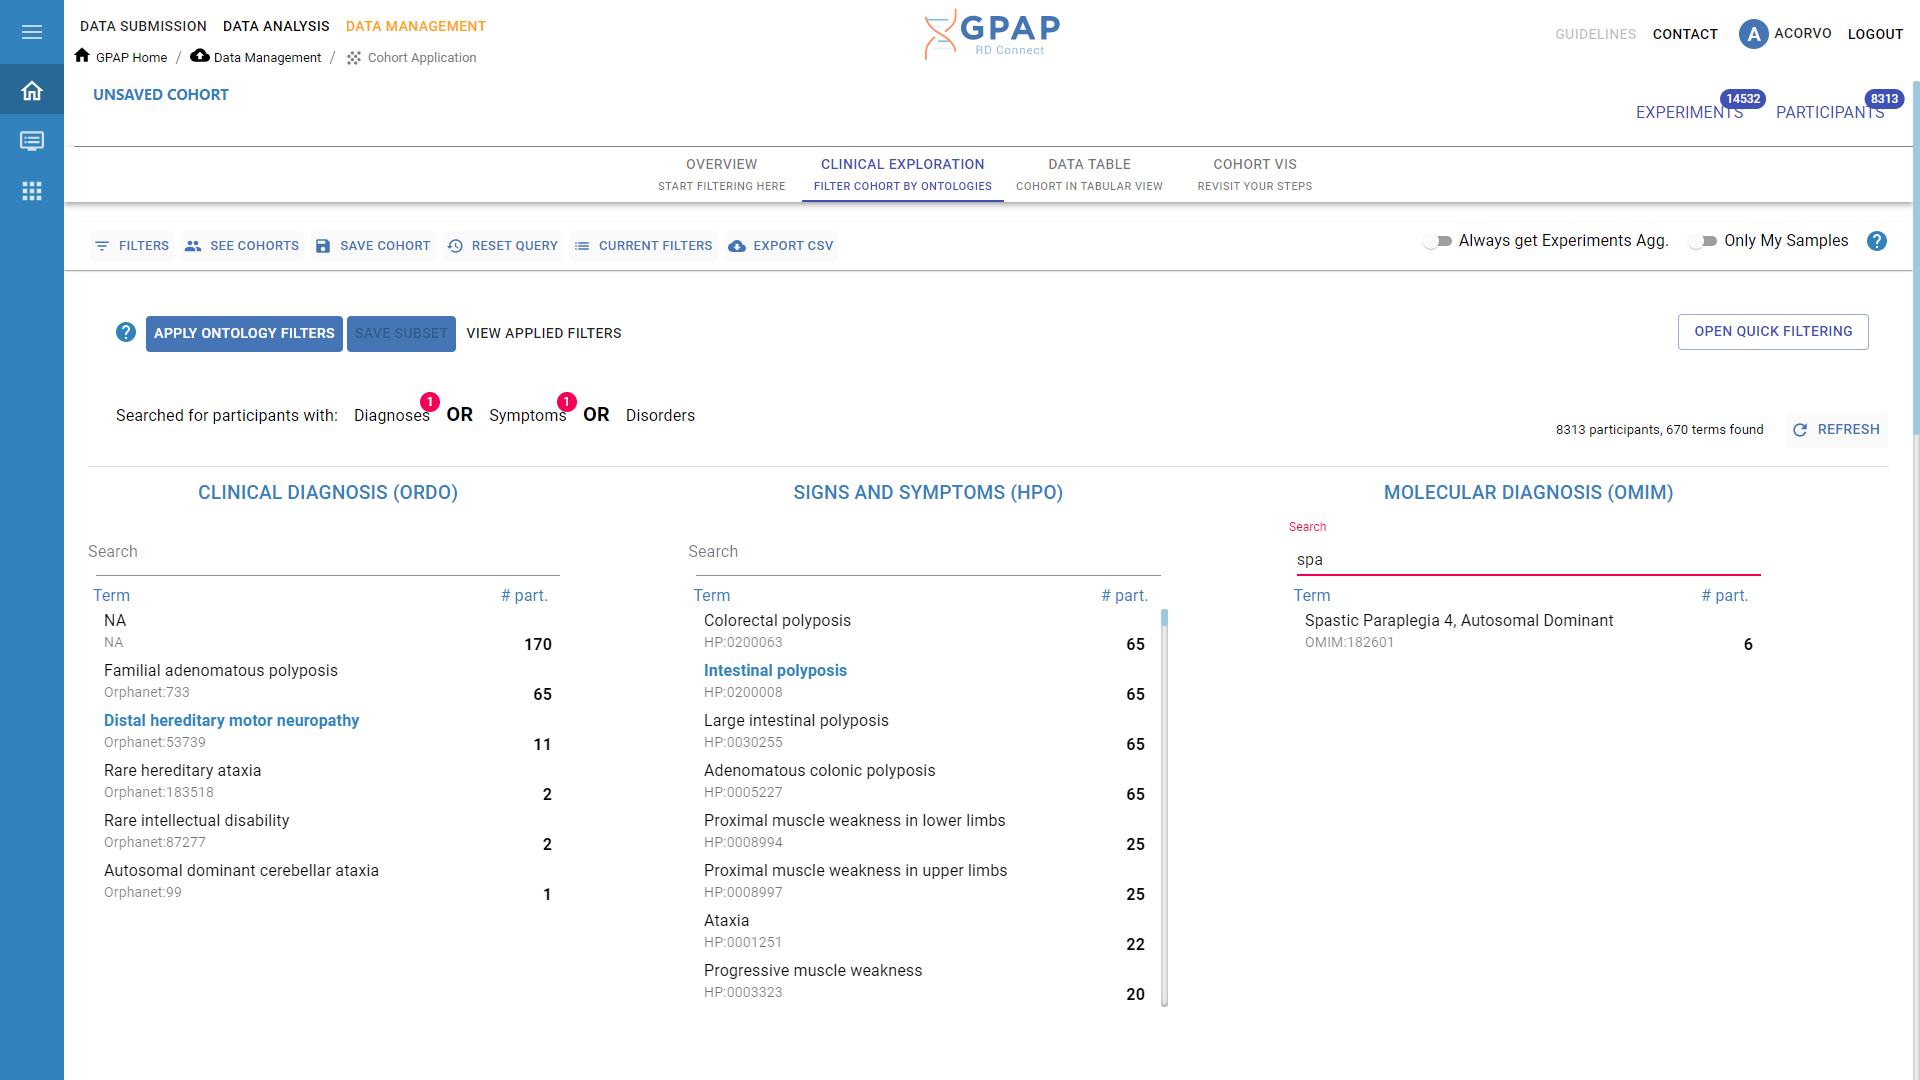
Clinical Exploration. This is the main view to filter by Diagnosis (ORDO terms), Symptomps (HPOs), Molecular Diagnosis (OMIM),
Tabular View, it shows the current cohort in tabular format, and
CohortVis, where you can review your steps and go back and forth in your cohort construction

In every view, the toolbar stays visible to allow to save the cohort, reset the filters, view current filters, and view saved cohorts. We discuss these options in the Operations section.
Overview
In the Overview, you will see a number of boxes that display the experiment metadata such as projects, ERNs, and participant information such as sex, solved status, consanguinity etc. Every item is clickable. A click allows to filter the records in the database to create a cohort.
Important
Participants are collected on the basis of the experiment permissions of the groups you belong to
Clinical Exploration
To filter participants by structured ontology terms, go to this panel. If no filters are applied, you will see the view A. Otherwise, view B is displayed if one or more filters have been applied and a cohort is already in place. Three boxes include the aggregations for ORDO, HPO, and OMIM terms within your cohort. You can click an item in the list or search in the search-area to find a term of interest. By clicking on Apply Selection at the top left corner, you will filter the cohort. This operation still allows to find the right combination of terms. When you are satisfied, you can click on Save Subset to confirm the cohort.
Tabular View
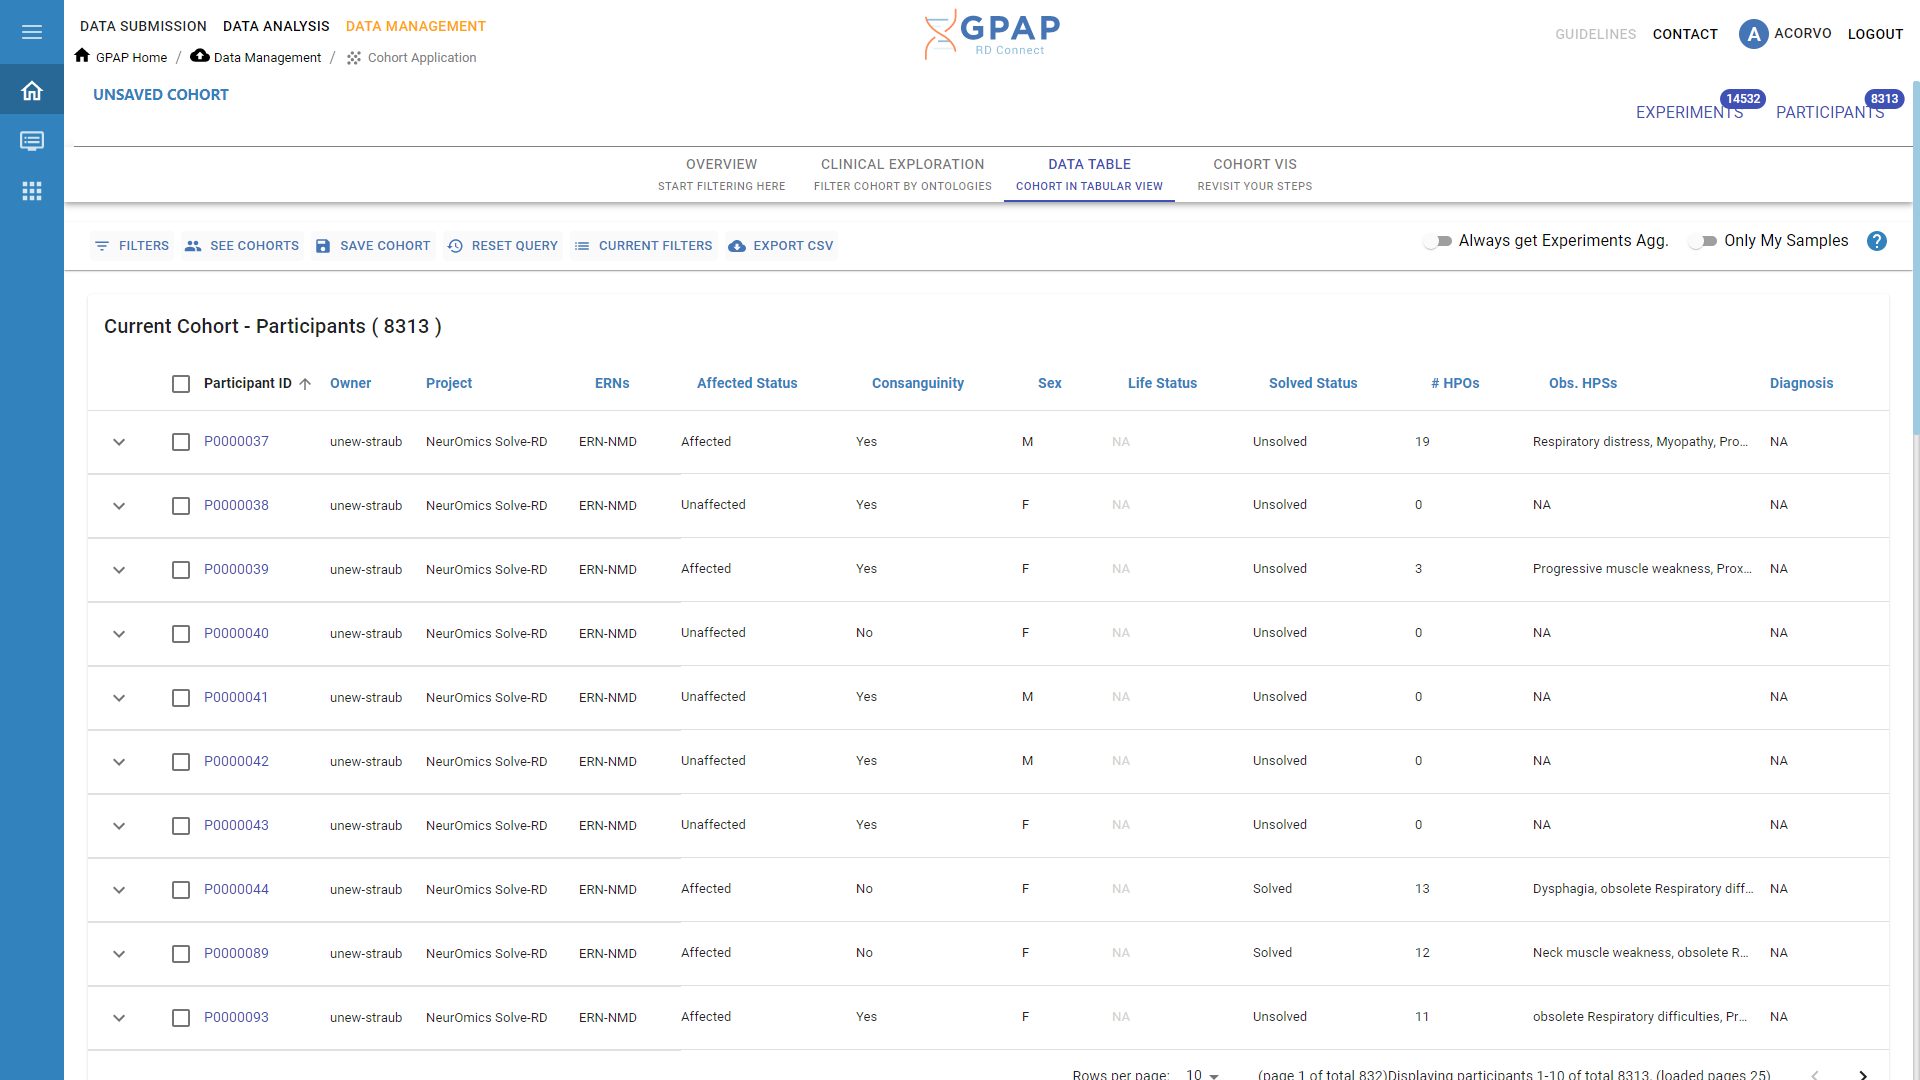
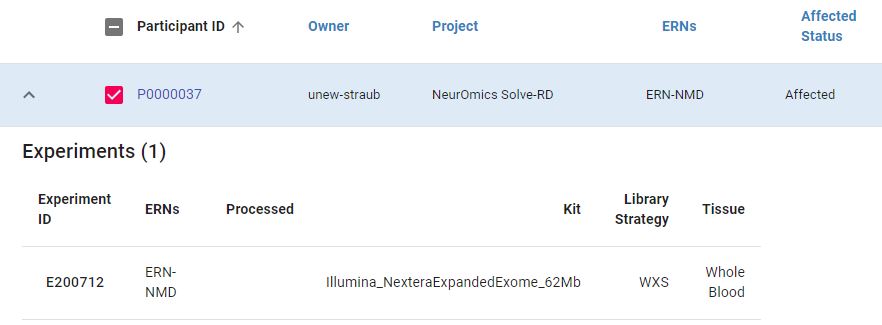
In this view, you can look at the participants in the current cohort. The main clinical information such as ORDO, HPOs are displayed for each participant. Eventual experiments are displayed in a collapsable row visible when selecting the participant.
- Note
Records are displayed as a preview of 250 participants. If you are interested in all records, you can export the cohort in CSV format by clicking on the button in the toolbar.
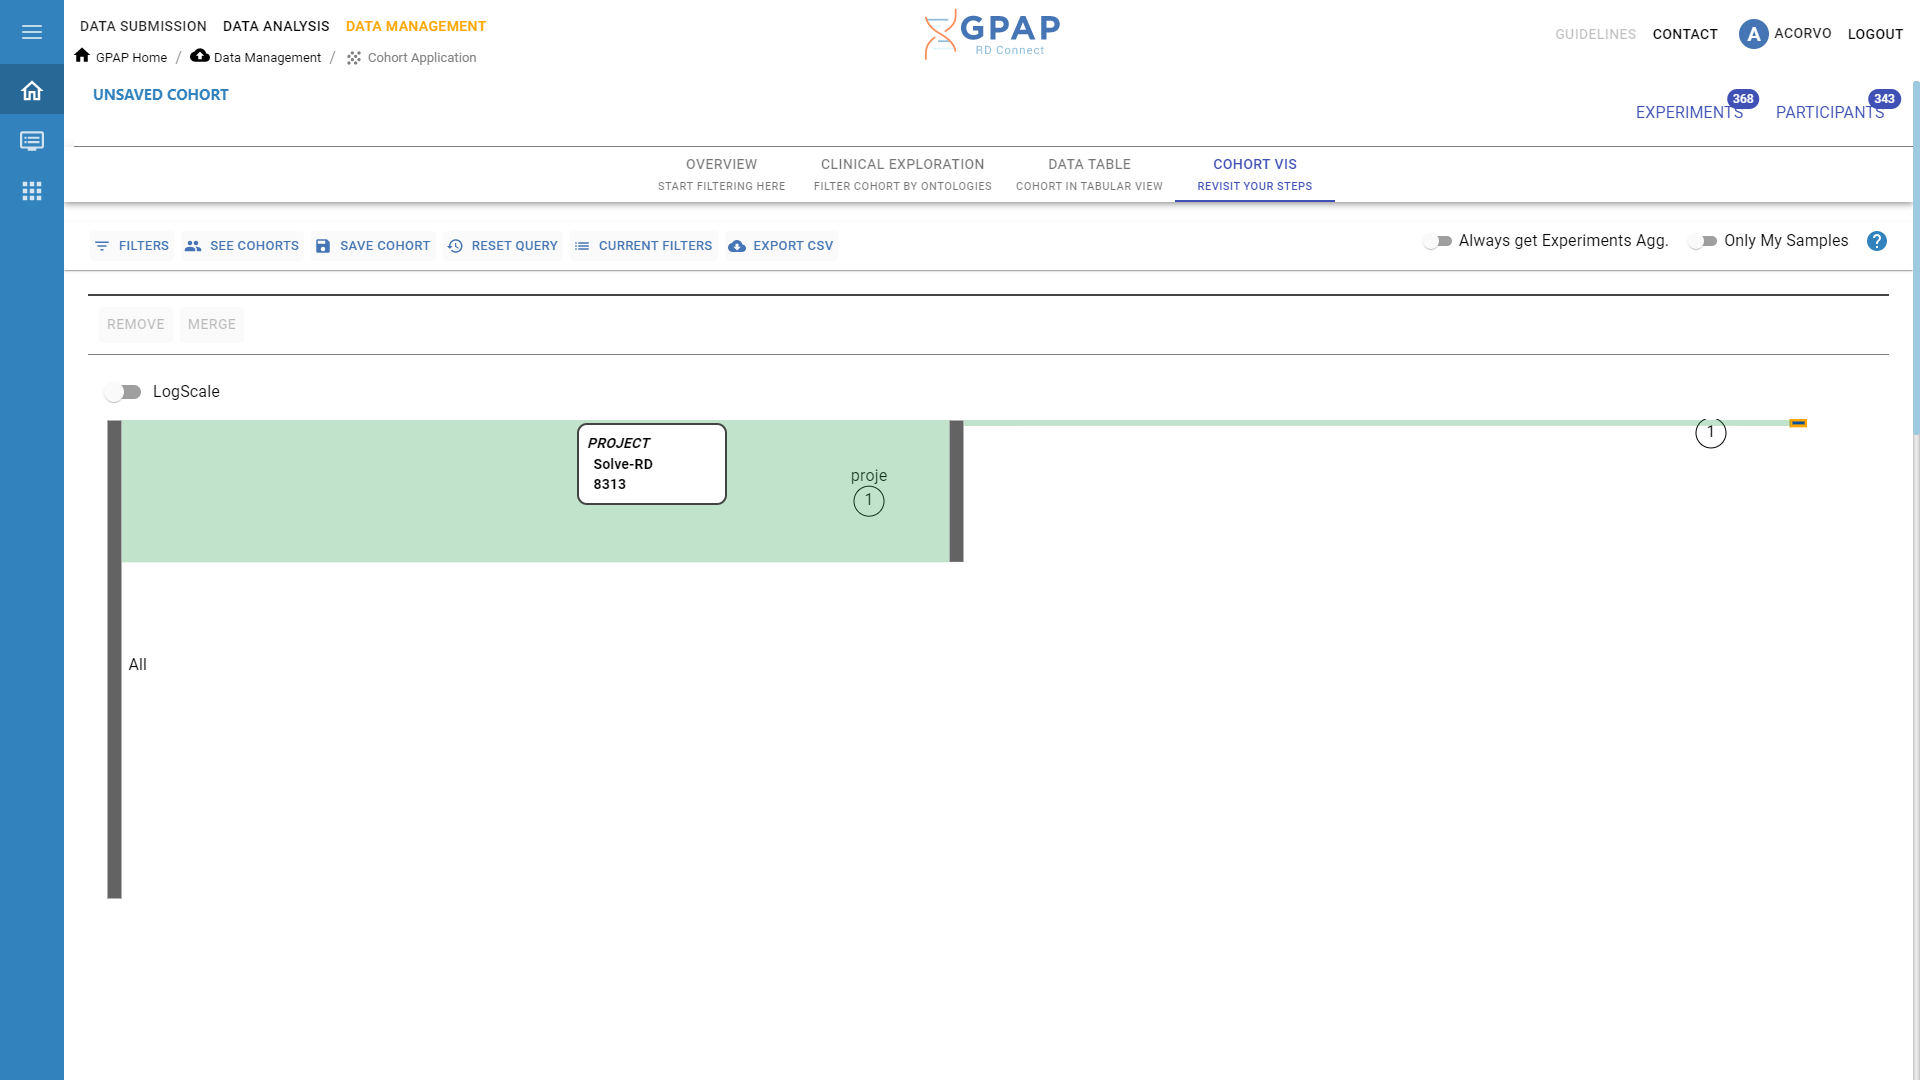
CohortVis
This view is meant to provide a visual history of the steps performed to obtain the current cohort. This type of visualization is called Sankey’s Diagram and it displays cohorts as rectangular boxes which height indicates the number of participants included in the cohort after applying a specific filter.
Operations
Save, See and Load Cohorts
To Save a cohort, click on the Save Button in the toolbar at any time during your Cohort Construction. You will be asked to provide a name and a description for your cohort. You can review the applied filters and the total number of participants in your cohort.
- Note
Soon we will include the option to directly analyze this cohort in the GPAP Genomics application.
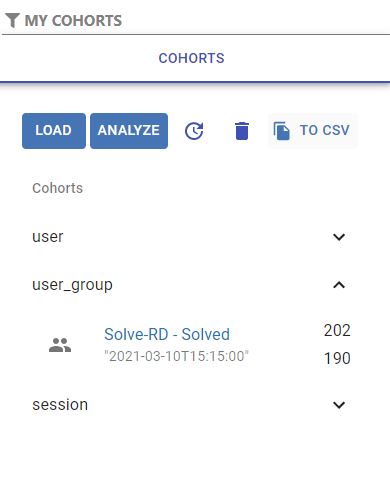
When saved, the cohort is visible in the cohort list. To see this panel, click on the see cohorts in the toolbar. A click on one of these cohorts will select the cohort that can then be loaded or deleted.
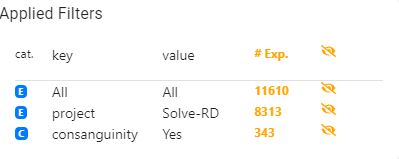
To review the current filters, click on View Applied Filters
Filter by your samples
In the toolbar, on the right, you will find this switch button

By activating the option Only My Samples, you will only see the samples and associated participants visible to your group/s. Any filter will be applied only to that restricted group of experiments/participants.
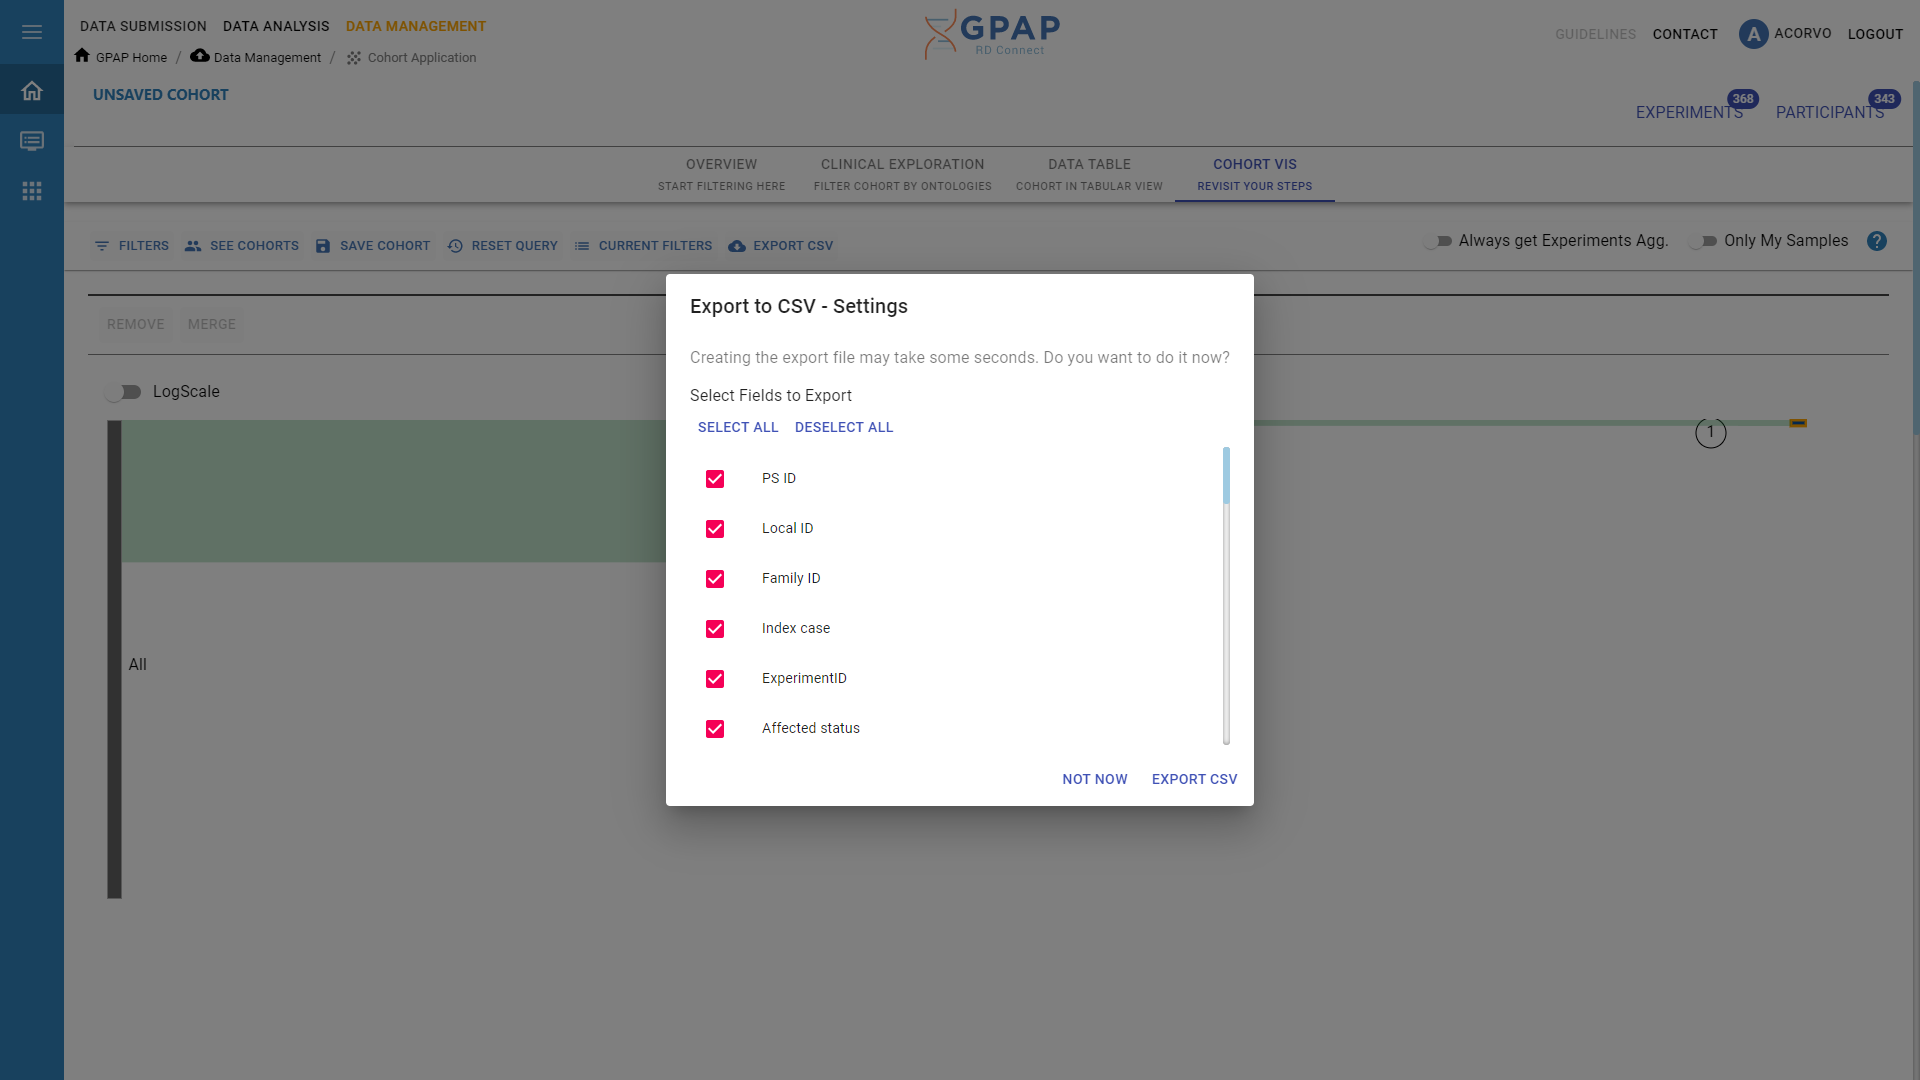
Export CSV
To export the current list of Experiments and participant information associated to them, click on the Export CSV button. A dialog will appear. On this, you can select the columns that you want to include in your csv file. Click the checkboxes to discard or include the fields in the csv file, and press Export. According to the size of the cohort, generating the file may take some seconds.
External Resources
We rely on a set of external resources to facilitate participant data submission in a standard format.
The Orphanet Rare Disease ontology (ORDO): https://orpha.net
Online Mendelian Inheritance in Man (OMIM) : https://api.omim.org/
The Human Phenotype Ontology (HPO) : https://hpo.jax.org/
Gene Search (HUGO Gene Nomenclature Committee): https://www.genenames.org