Genomic Analysis
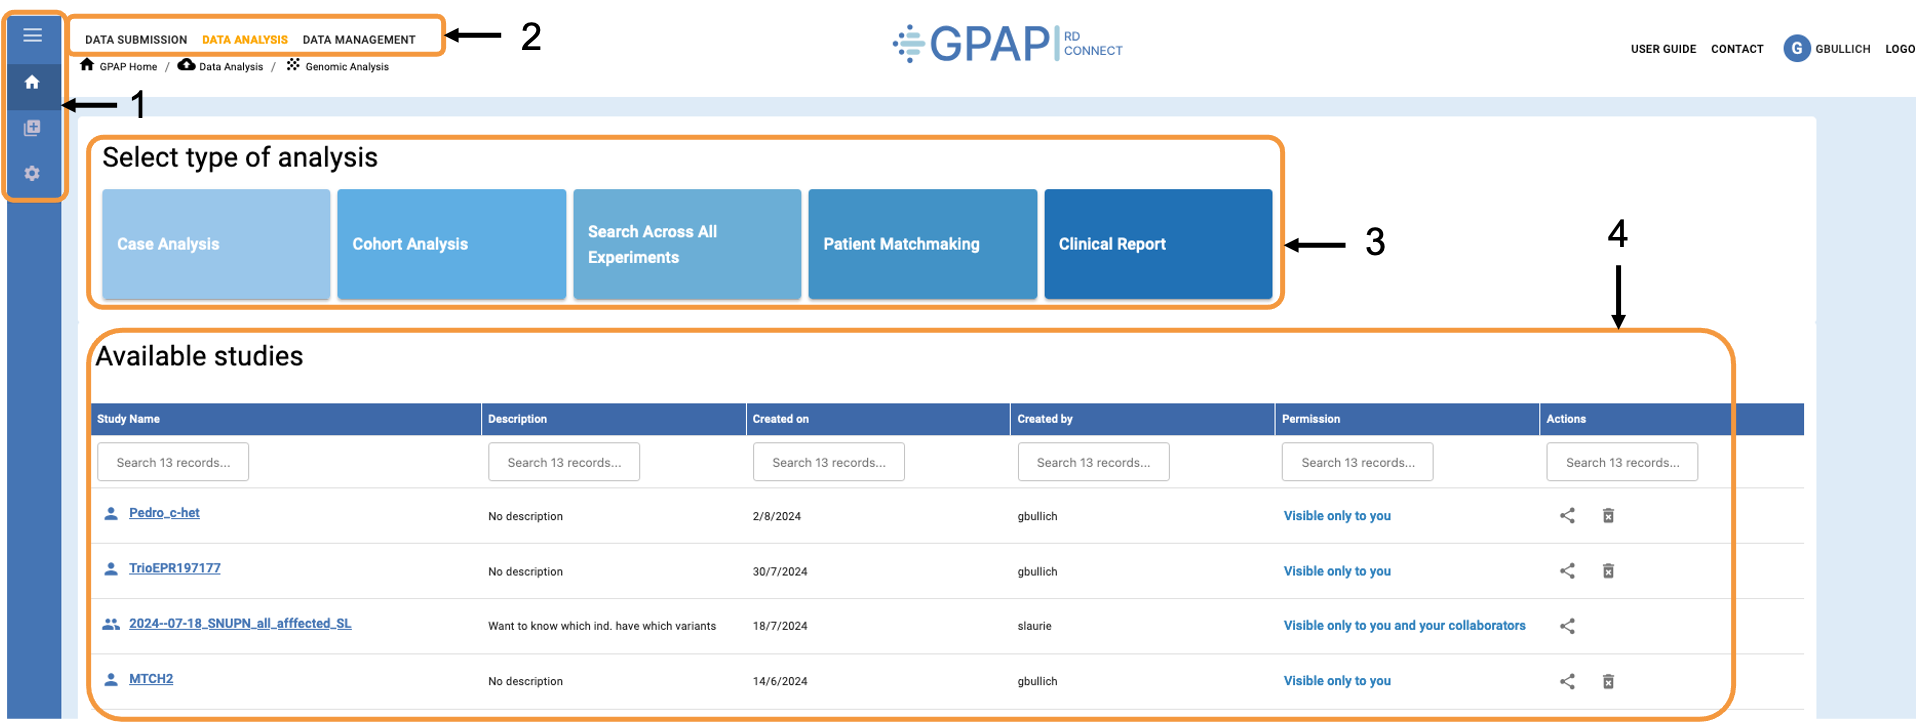
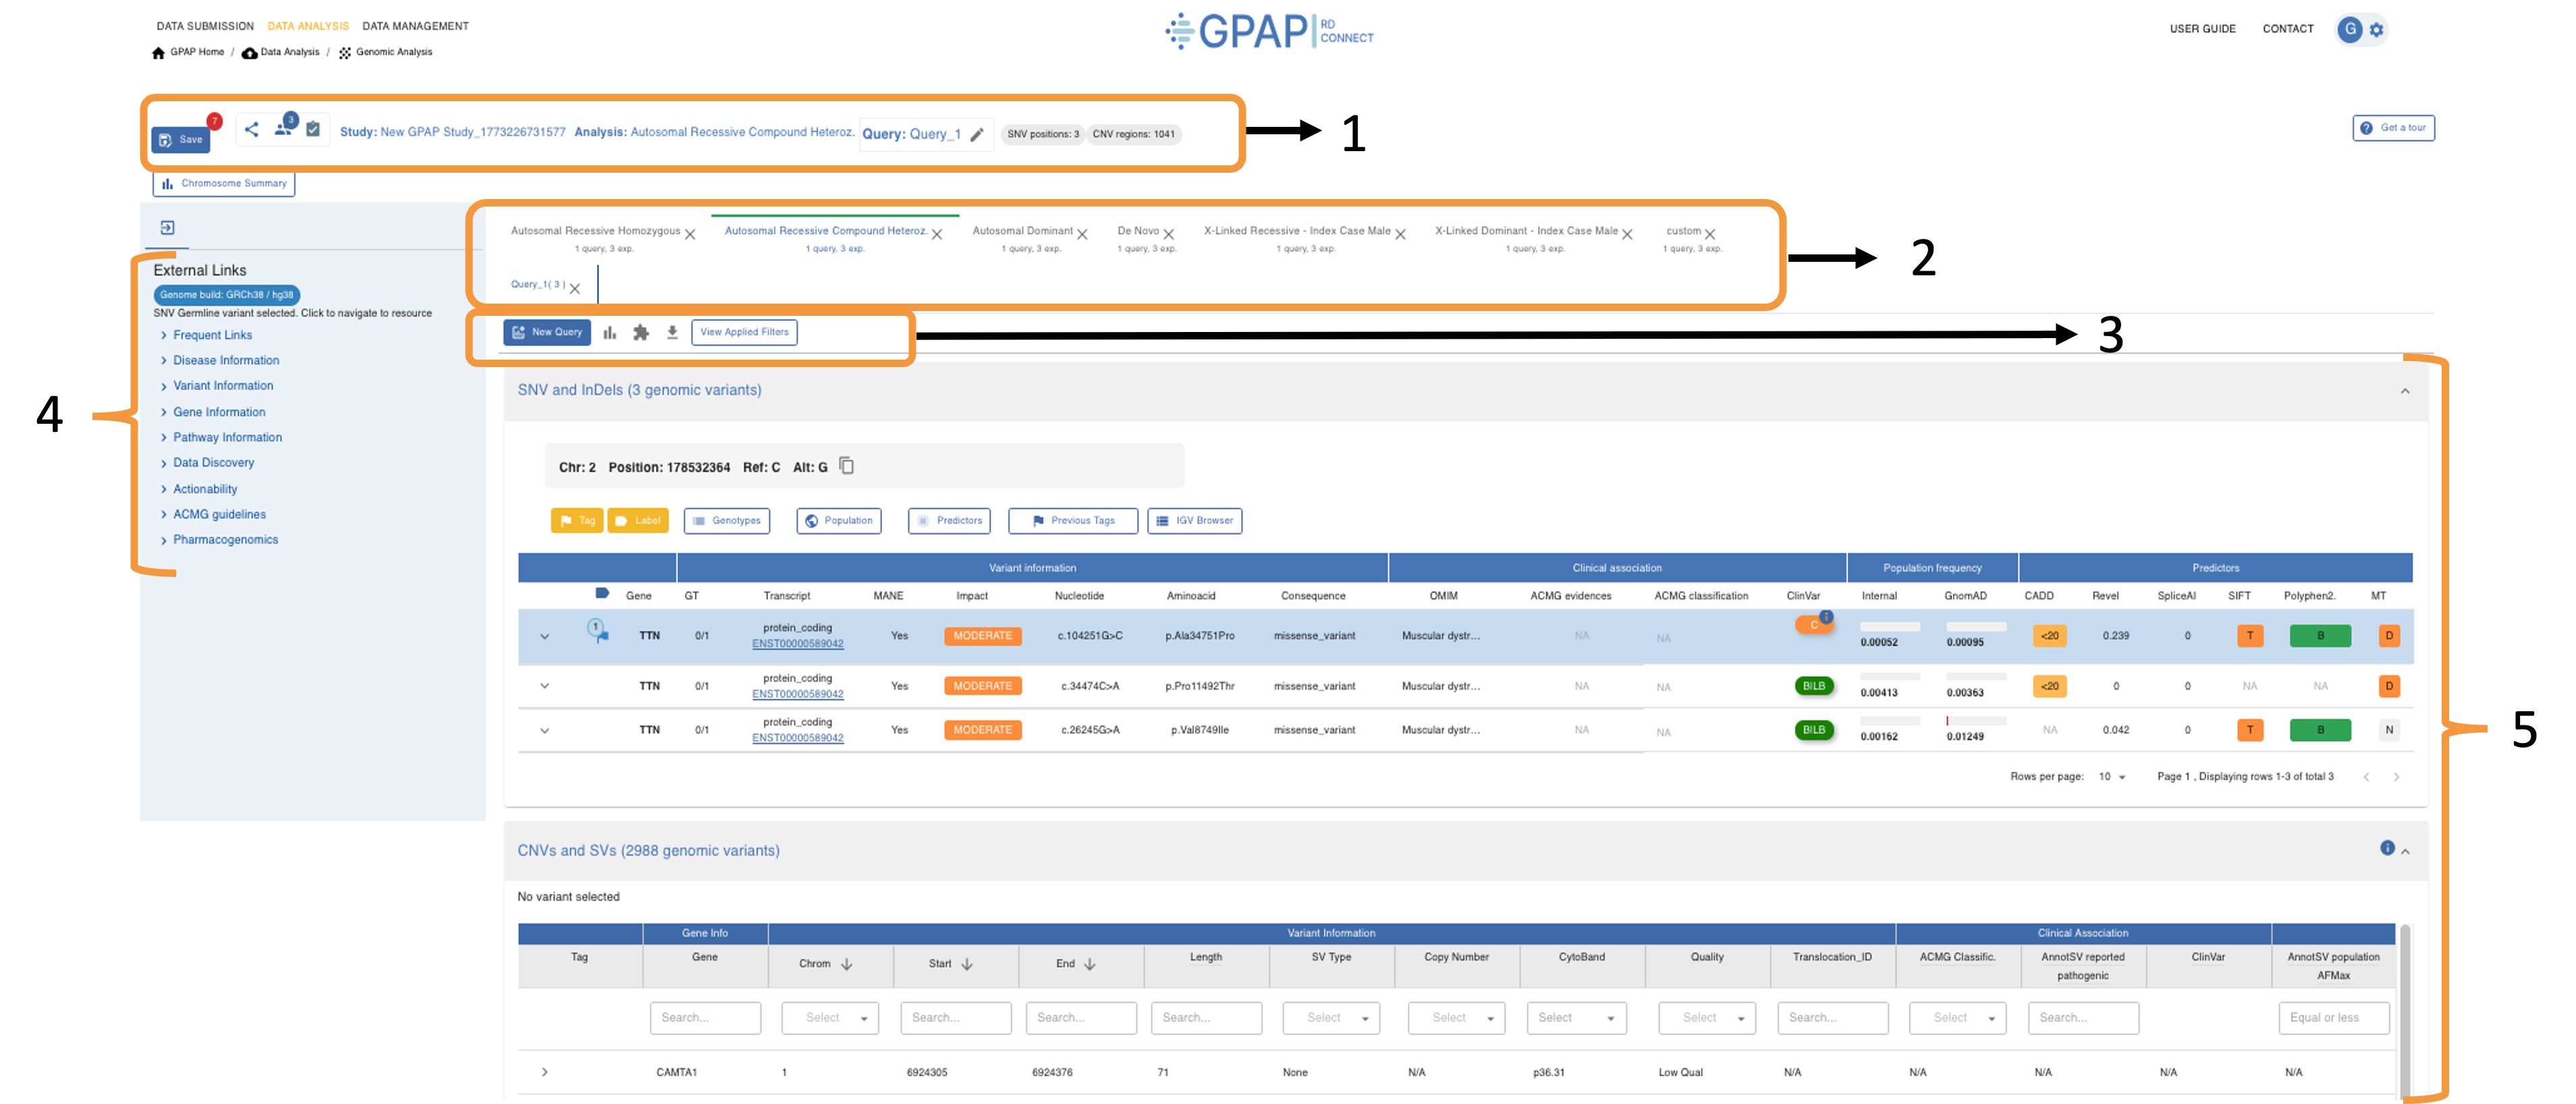
The Genomic Analysis module provides a user-friendly interface to analyse genomic experiments. The image below displays the Genomics module dashboard, highlighting its key functionalities.
Fixed sidebar across the Genomic module, providing quick access to various functionalities.
Toolbar for accessing other GPAP modules, including: Data Submission and Management (Experiment & Files, and Phenotypic Data) and Data Analysis (Genomic Analysis and Cohort Creation).
Menu for selecting your desired action.
Summary of your accessible saved studies
Study setup
The GPAP provides several types of analysis based on your specific needs:
Case Analysis: For analysing a single case or family.
Cohort Analysis: For analysing cohorts created in the CohortApp
Search Across All Experiments: For searching across all accessible experiments within the GPAP.
To set up a study for your chosen type of analysis, please follow the guidelines in the corresponding section below.
Case Analysis
Click on the Case Analysis button in the Genomic Analysis dashboard to analyse a single case or family.
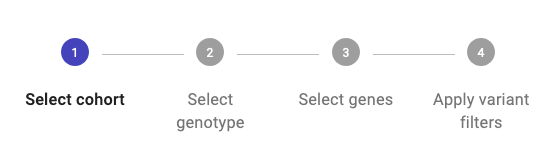
The system will guide you though the required steps for the study creation. In the following sections we describe those steps in further detail.

1. Select experiments
Here, you can search for an experiment, participant or family using up to five ID options. Correlations among the different IDs can be found in the Data Management module (see Experiment Data section):
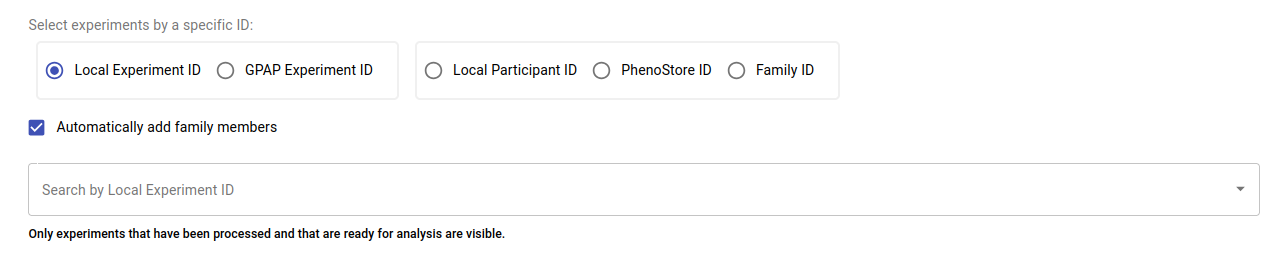
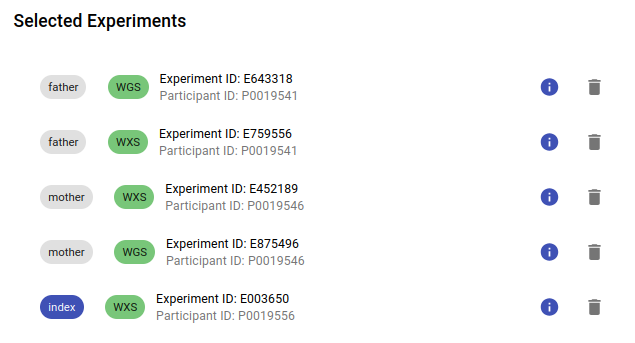
By default, the family members of any selected participant will be included in the analysis. You can disable this option by unchecking the Automatically add family members checkbox. Additionally, you can remove individual experiments from the analysis by clicking the bin icon next to each experiment, as shown in the image below.
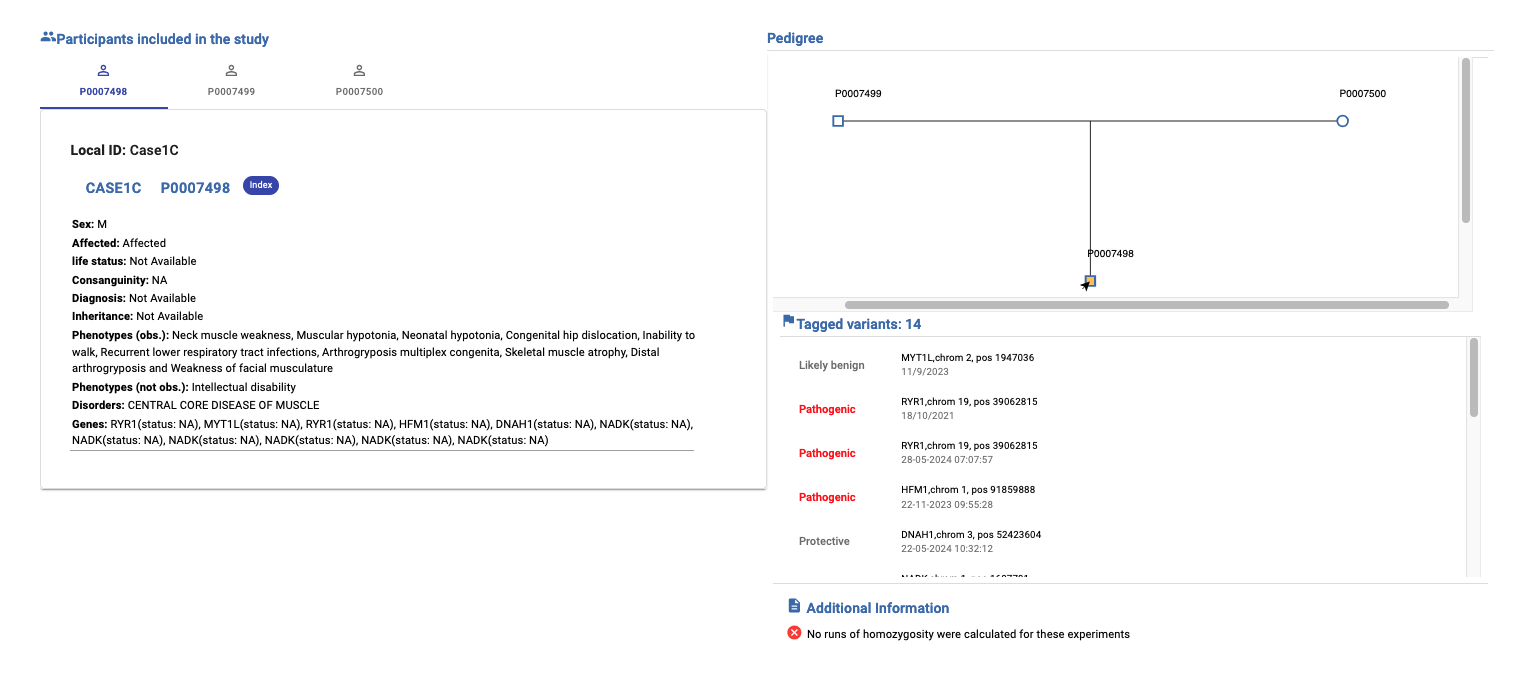
2. Review case information
This section provides an overview of the available information about the participants included in the study. You can review the data and access PhenoStore if you need to check or update any additional details.
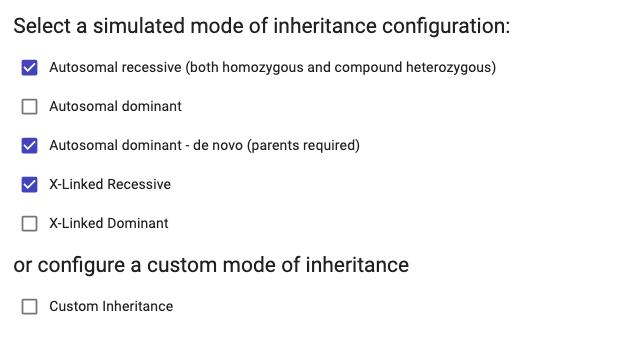
3. Select inheritance mode
- Here, you can select the inheritance mode(s) that you would like to assess. We offer two options:
Simulated Mode of Inheritance: Provides automatic configuration based on the recorded affected status of individuals in PhenoStore. Multiple simulated modes of inheritance can be selected.
Custom Mode of Inheritance: Allows users to select the genotype(s) to be included in the analysis. This option can be selected alongside the simulated mode.
Note
The compound heterozygous simulated inheritance assumes the unaffected individuals are the progenitors. The system does not currently allow testing for unaffected siblings.
The mode of inheritance is not considered for the CNV analysis.
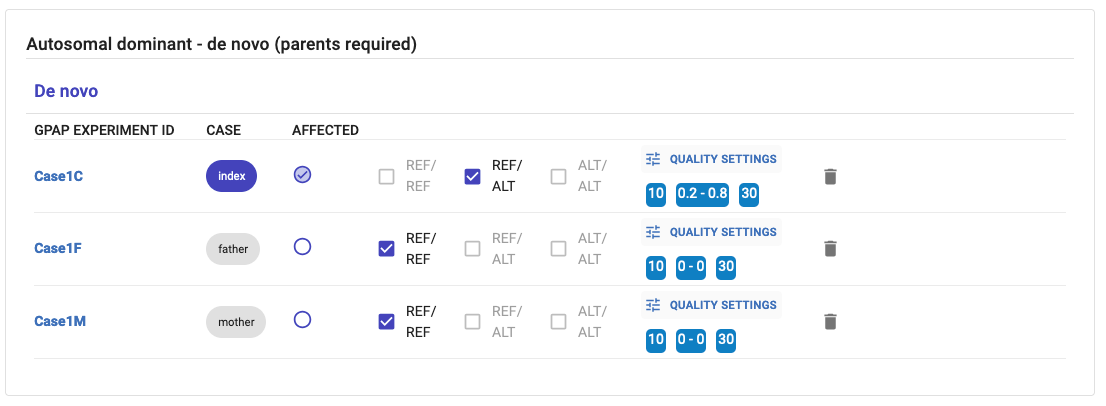
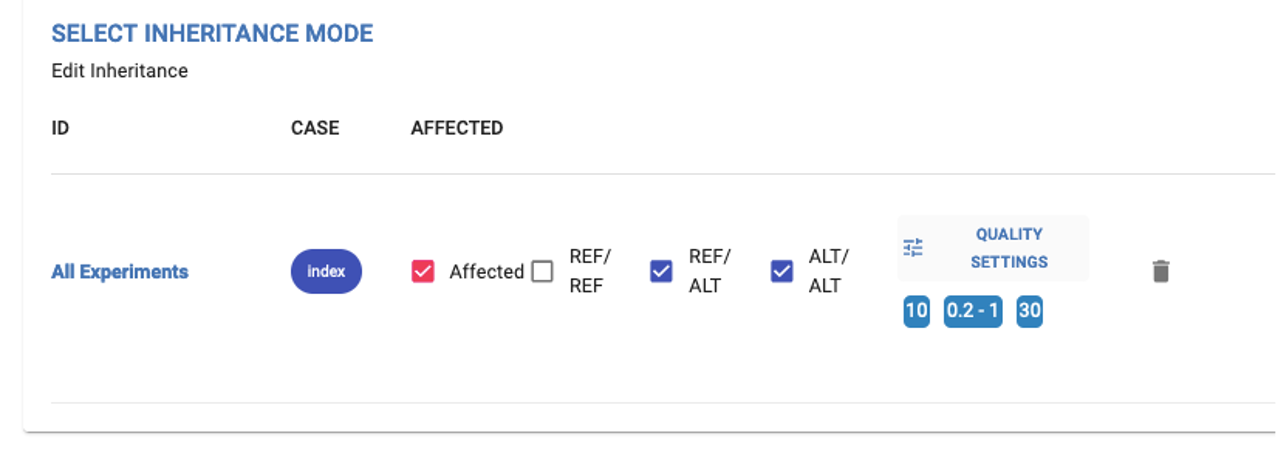
Example of simulated inheritance - Autosomal Dominant. You can only modify the quality settings. The affected statuses and the genotypes, are fixed:
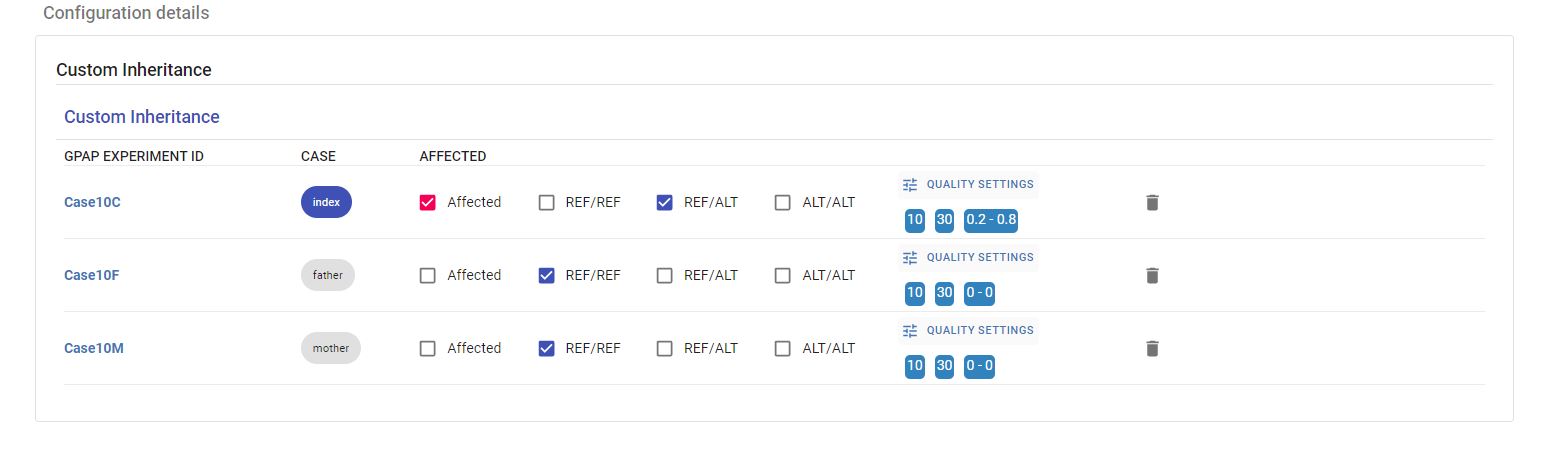
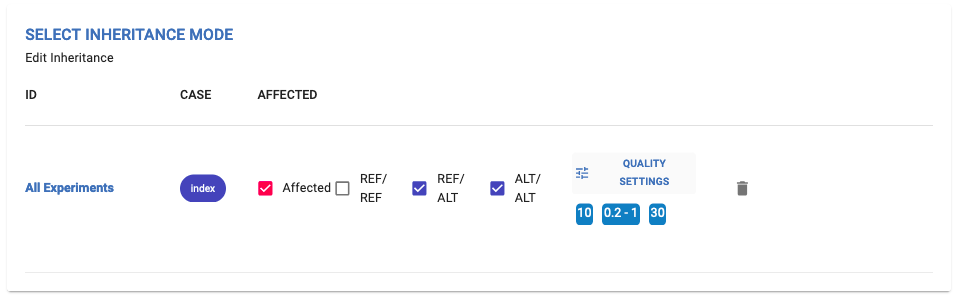
Example of Custom Inheritance. The user can change the affected status of the individuals, the genotypes and the quality settings:
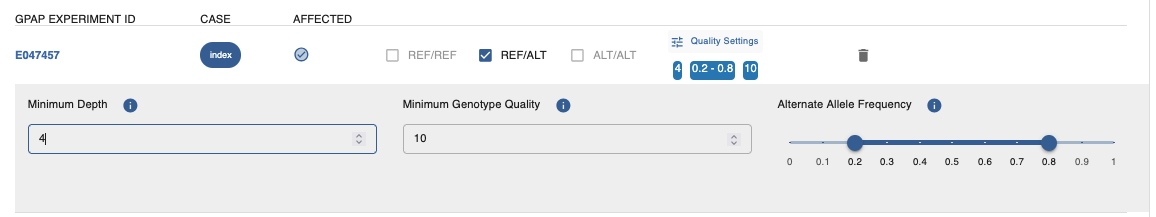
Quality Settings
All PASS variants with a minimum depth of coverage of 3 for exomes and 1 for genomes are uploaded to GPAP. Quality settings can be adjusted for each inheritance mode and participant by clicking the Quality Settings button. A minimum depth of coverage of 4 and genotype quality of 10 for a variant position are considered by default. The Alternate Allele Frequency for the corresponding inheritance mode is displayed and can be modified using the slider shown in the image below.
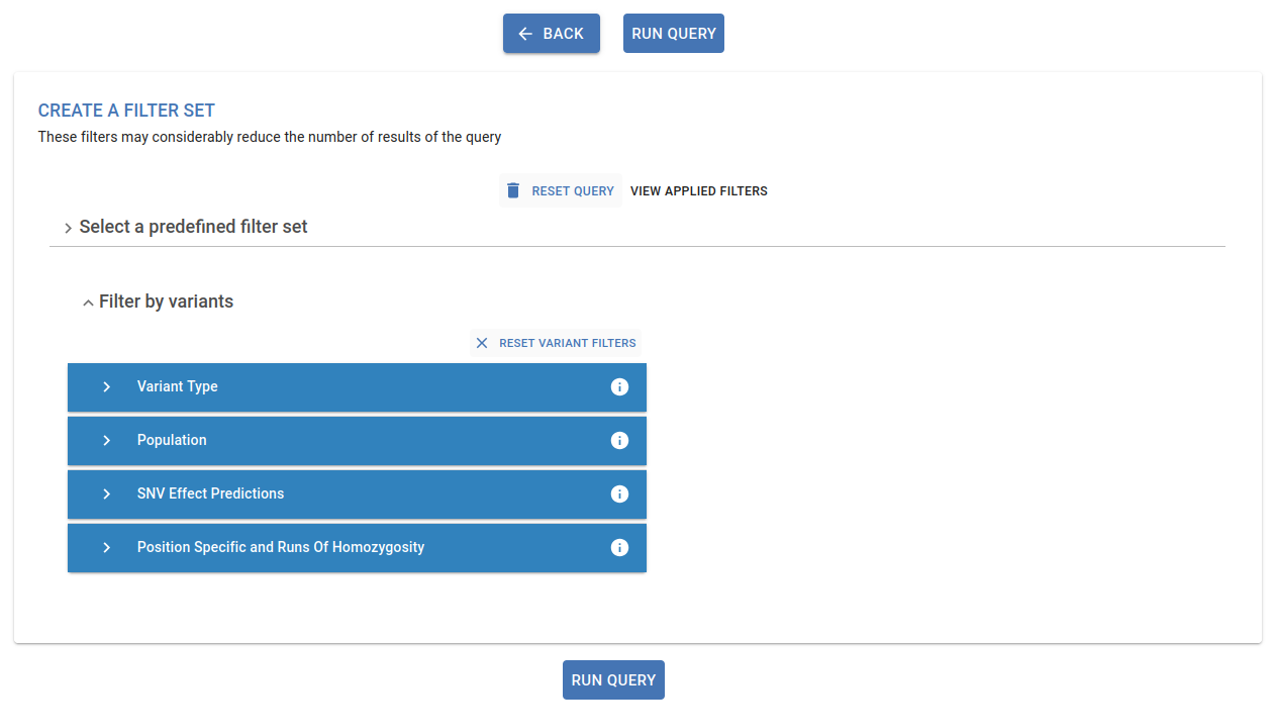
4. Apply filters
In this final step, you can apply various filters to narrow down the number of obtained variants. These filters are grouped into the following sections: Predefined Filter Set, Filter by Variants and Filter by Genes. Refer to the Filtering section in this guidelines for more details.
Now click on Run Query to obtain the results. Navigate to the Variant Dashboard section in this guidelines for comprehensive guidance on analysing the results.
Cohort Analysis
Click on the Cohort Analysis button in the Genomic Analysis dashboard to analyse cohorts previously created in the CohortApp. Refer to the Cohort Application section in this guidelines for further details. By going through the steps described below, a study will be created.
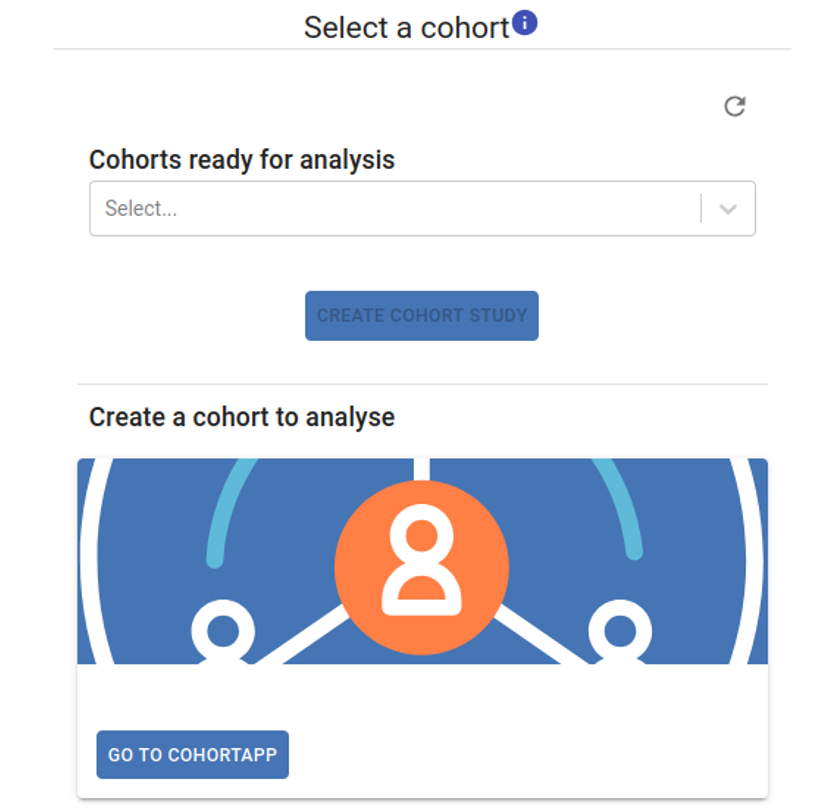
1. Select a Cohort
Your cohorts will be displayed in the Cohorts Ready for Analysis dropdown list. Select the desired cohort and click the Create Cohort Study button to initiate your study.
2. Select genotype:
Select the genotype(s) and quality settings you want to consider for your analysis (same as the Custom Mode of Inheritance configuration in the Case Analysis use case).
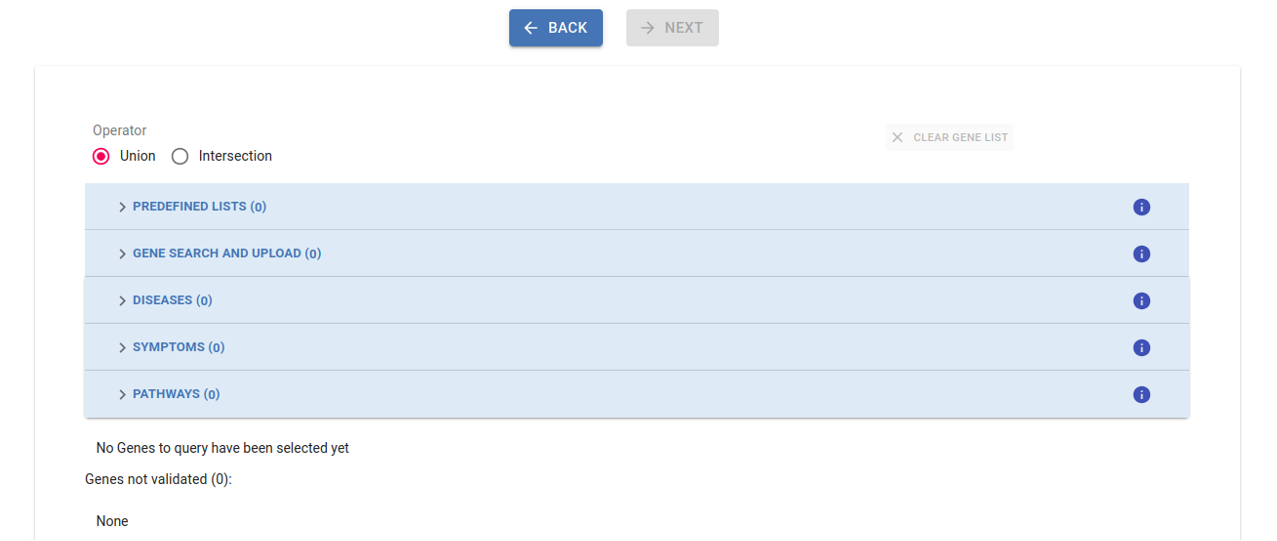
3. Select Genes:
Select gene(s) or gene list(s) from the different sections to narrow down the number of obtained variants, with the inclusion of at least one gene being mandatory for the analysis. By default, the union of selected genes is considered, but you also have the option to apply the intersection among gene lists from different sections. Refer to the Filtering section in this guidelines for more details.
4. Apply variant filters:
You can now apply variant filters, which we strongly recommend to narrow down the obtained results and minimize computational effort. Please refer to the Filtering section in this guidelines for further details.
Now click on Run Query to obtain the results. Navigate to the Variant Dashboard section in this guidelines for comprehensive guidance on analysing the results.
Search Across All Experiments
Click on the Search Across All Experiments button in the Genomic Analysis dashboard to create a new study that allows you to search across all your accessible experiments.
Warning
This use case may lead to system performance issues when millions of variants are returned
To run a search across all your experiments, you have to go through the following three steps:
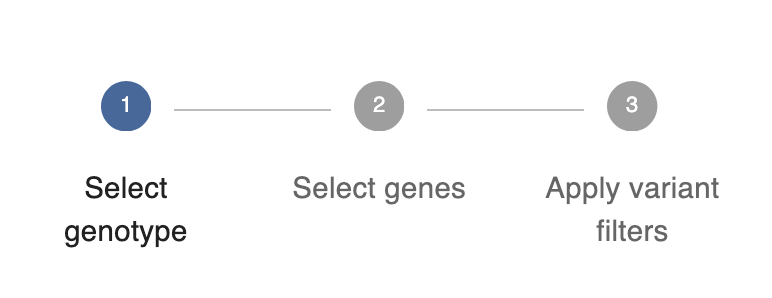
1. Select genotype
Select the genotype(s) and quality settings you want to consider for your analysis (same as the Custom Mode of Inheritance configuration in the Case Analysis use case).
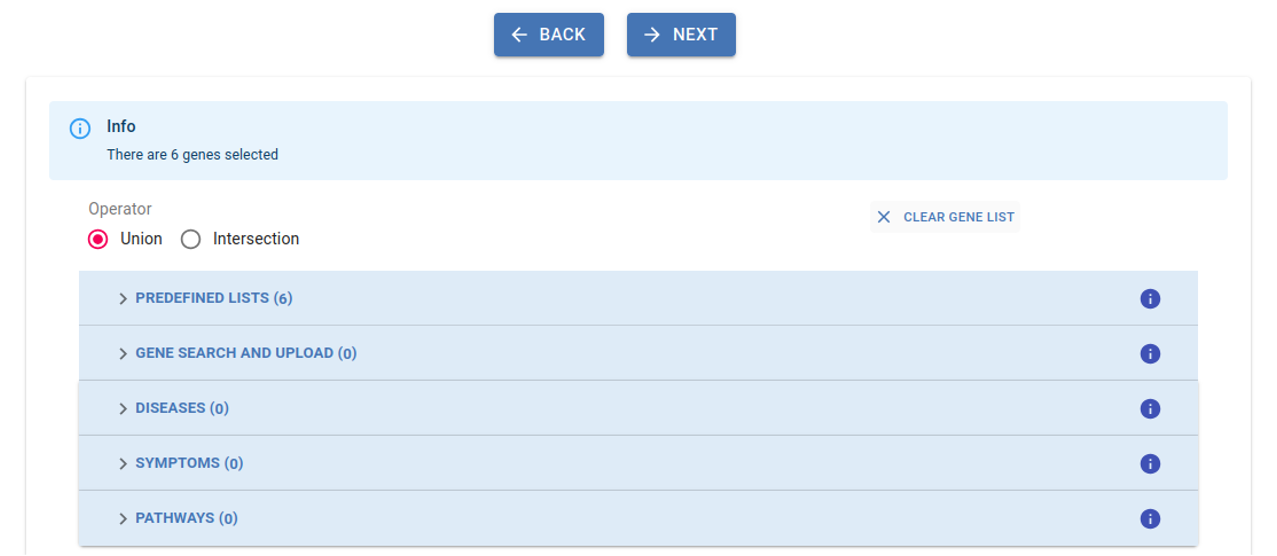
2. Select genes
Select gene(s) or gene list(s) from the different sections to narrow down the number of obtained variants, with the inclusion of at least one gene being mandatory for the analysis. By default, the union of selected genes is considered, but you also have the option to apply the intersection among gene lists from different sections. Refer to the Filtering section in this guidelines for more details.
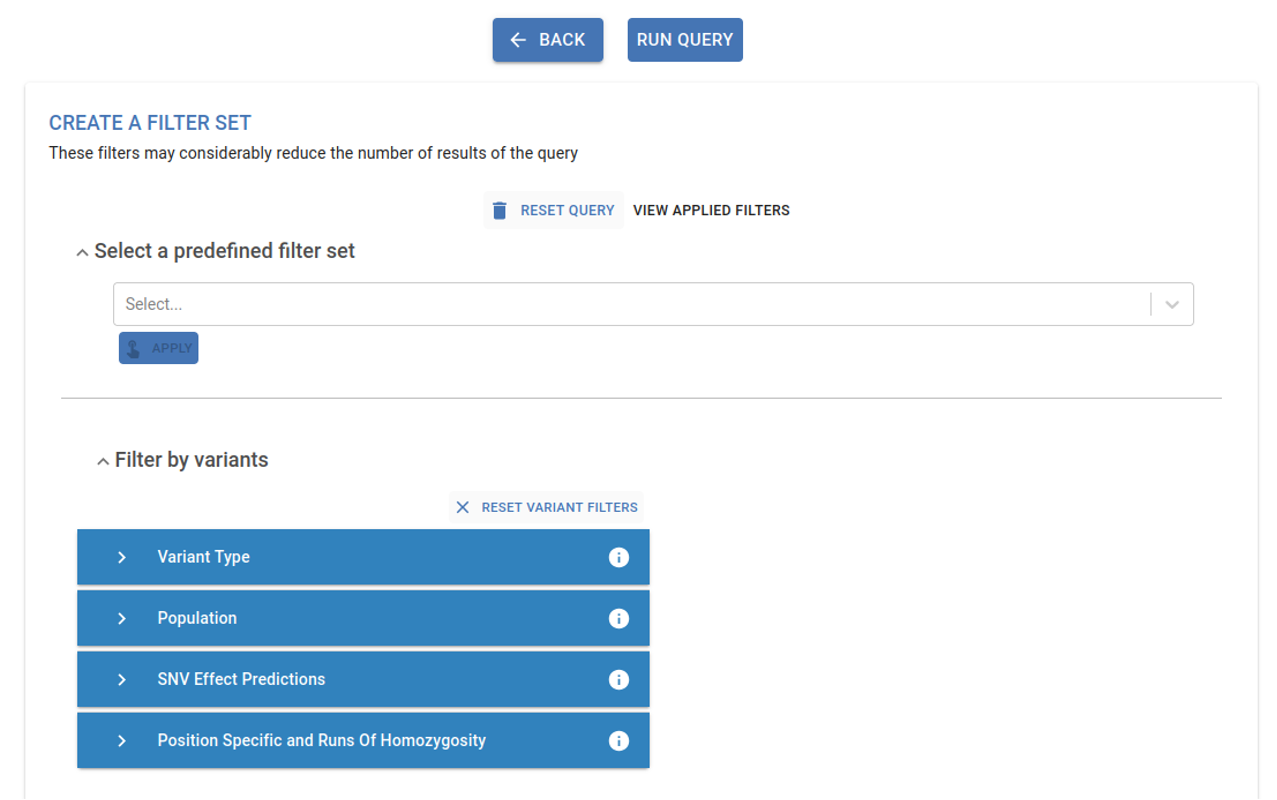
3. Apply variant filters
You can now apply variant filters, which we strongly recommend to narrow down the obtained results and minimize computational effort. Please refer to the Filtering section in this guidelines for further details.
Now click on Run Query to obtain the results. Navigate to the Variant Dashboard section in this guidelines for comprehensive guidance on analysing the results.
Filtering
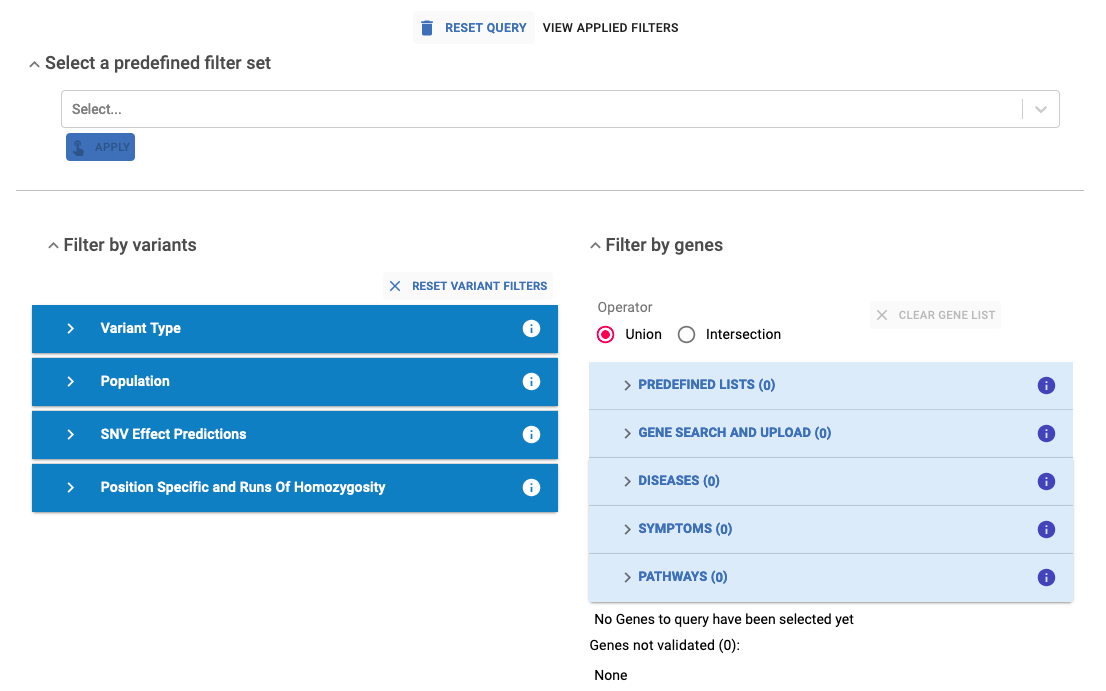
The genomics analysis provides different filters that can be used to narrow down results and candidate pathogenic variants. Those filters are grouped in the following sections: Predefined filter set, Filter by variants and Filter by genes
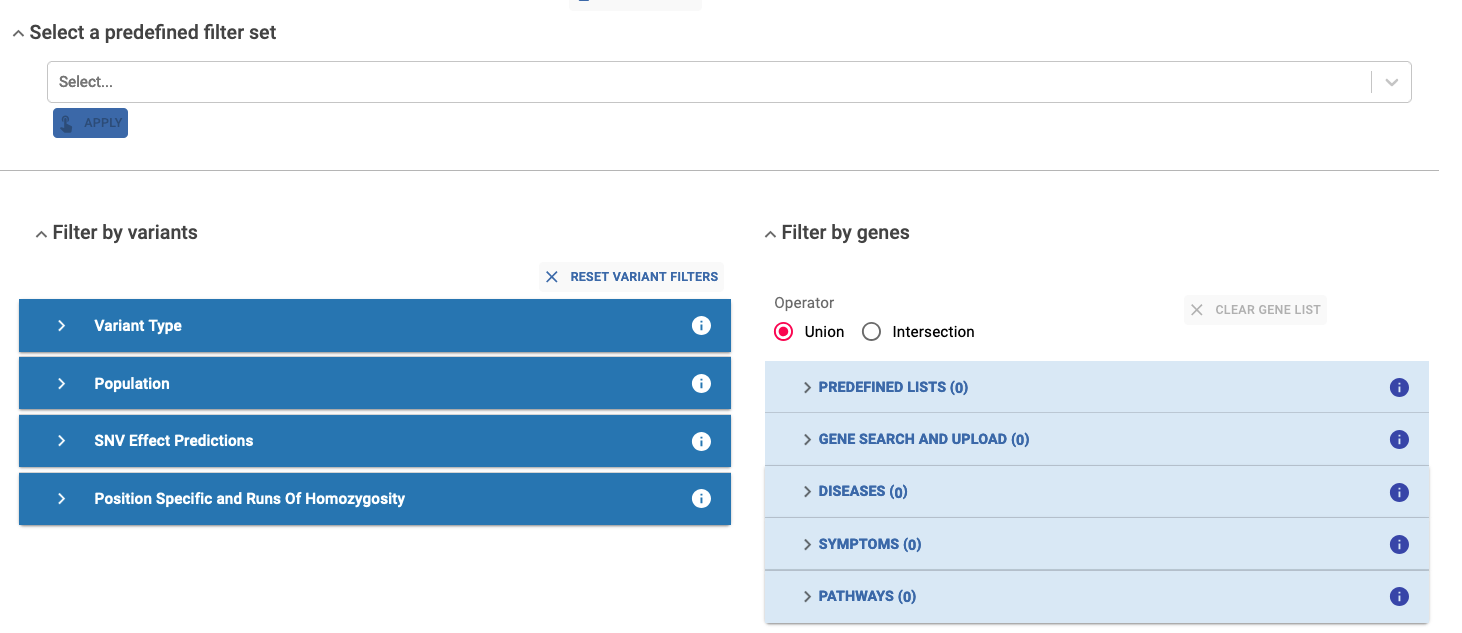
Predefined filter set
Specific set of predefined filters for a high, medium, or low stringency analysis. Select the desired filter set from the dropdown menu and click Apply to automatically configure the filters in the Filter by variant section.
Variant Filters
The available Variant Filters depend on the type of variant:
SNVs: all Variant Filters apply.
InDels: all Variant Filters apply except the ones in the SNV Effect Predicions filter section.
CNVs/SVs: Only ClinVar Classification and Internal Frequency filters apply.
Variant Type:
Protein Impact, as defined by Variant Effect Predictor (VEP).
Variant Consequence, as defined by Variant Effect Predictor (VEP).
ClinVar Classification: ClinVar aggregates information about genomic variation and its relationship to human health. Applies to both SNVs/InDels and CNVs/SVs (refer to ClinVar section in the CNV/SV analysis section for further details).
Variant Type: SNV and Indels
Tagged Variants: filter by tagged variants for all Experiments or for a selected set only.
Transcript Biotype: Coding, RNA and Other.
MANE: select Mane Select to restrict the results to MANE selected transcripts.
Population:
GnomAD AF: only genomes from GnomAD version 4.1.0 are considered.
- Internal Frequency: Represents the frequency of a variant within our internal database and applies to both SNVs/InDels and CNVs/SVs:
SNV/InDels: only variants that pass the defined quality thresholds are considered (see Quality Settings section). It is calculated as number of alleles carrying a specific variant divided by the total number of alleles in the database.
CNV/SV: internal frequency for CNVs and SVs is calculated separately but under the same considerations. Two events are considered the same if they are the same type and have at least 70% reciprocal overlap. It is calculated as the number of individuals carrying a specific variant divided by the total number of individuals in the database (refer to Internal Frequency section in the CNV/SV analysis section for further details).
SNV Effect Predictions:
Mutation Taster
SIFT
Polyphen2 hvar
InterVAR
CADD Prediction
Revel Prediction
SpliceAI Prediction
Warning
These filters only apply to SNVs. However, InDels are still displayed to prevent accidentally missing potentially relevant variants.
Position Specific and Run of Homozygosity:
Chromosome, Start Position and End Position
Upload Bed File
Upload Coordinate file
Minimum run of homozygosity length
Gene Filters
All Gene Filters apply both to SNV/InDels and CNVs/SVs. They can be found grouped by the following search criteria:
Predefined Gene Lists: You can select gene lists pre-loaded in the system .
Gene Search and Upload (HGNC Database, https://www.genenames.org).
- Disease Related Genes:
OMIM : https://omim.org/
Genomics England PanelApp : https://panelapp.genomicsengland.co.uk/
- Symptoms - HPO: https://hpo.jax.org/
Extract HPO from analysed participants. The HPOs entered in PhenoStore are automatically displayed and can be removed.
- Search for HPOs.
After selecting the HPOs, the associated genes can be collected with the HPO database or the DisGenet database. You can then apply an internal intersection inside this section.
Pathways - from Reactome: https://reactome.org/
By default, the union of selected genes is considered, but you also have the option to apply the intersection among gene lists from different sections. During the filter creation process you can clear the gene list at any time and start over again by clicking the Clear Gene List button.
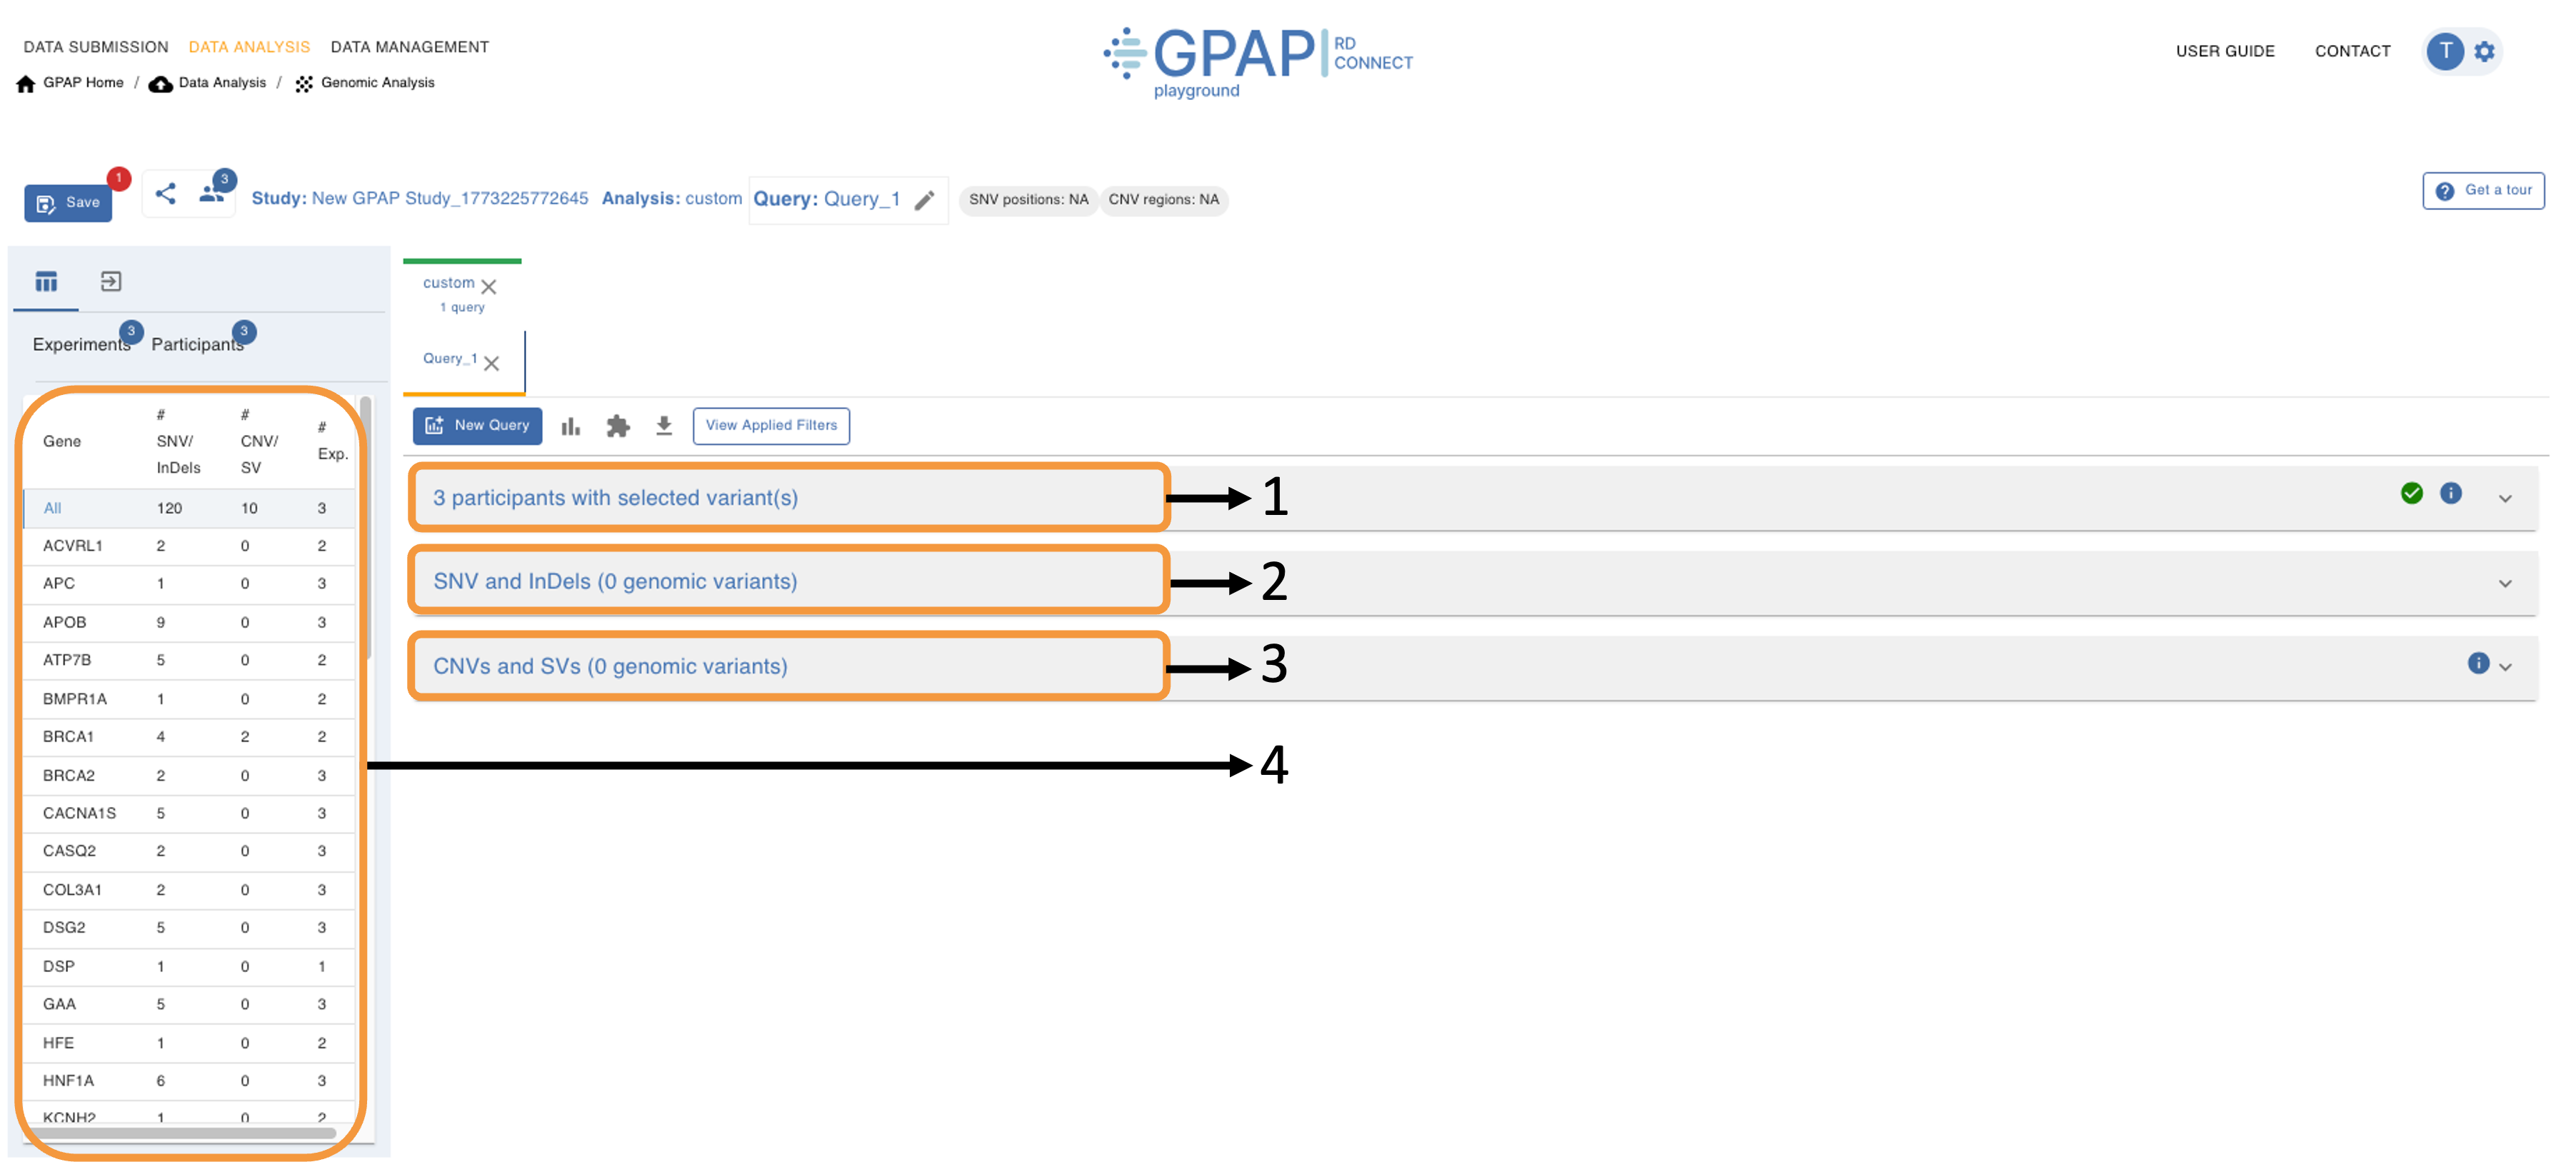
Variant Dashboard
The Variant Dashboard is a comprehensive interface designed to streamline the analysis of genetic variants, providing tools to efficiently explore and interpret the results. It has the following components:
Study Toolbar
Analysis and Query Tabs
Variant Table Toolbar
External Links and Databases
Results Table
All the components in the Variant Dashboard, except the Results table, are shared across the different types of analysis (Case Analysis, Cohort Analysis and Search Across All Experiments).
Study Toolbar
In this study header you can find the main information about your study and perform the following actions:
Save (Study): In case you have created new queries and they’re not saved, a number will be displayed on the upper-right corner of the Save button as you can see in the image below. Please, refer to the Save, share and delete studies section in this guidelines for further details.
Share Study: For sharing your work with other users via a url. You need to save the study prior to be able to share it.
View Participants/Experiment Information: Reviewing the main information of the analysed participants.
Analysis Status: to keep track of the status of experiments, you can change it to Analysed or Solved for a specific experiment (this feature is only available for Case Analysis use case).
Edit Query Name: Changing the name of the current query can be done at any time.
Number of variants in current query: Displayed by the query name. The SNV-InDel number corresponds to the number of genomic positions and the CNV region number corresponds to the sum of CNVs in both complete and split by genes views.
Analysis and Query Tabs
A separate tab is displayed for each tested inheritance mode (Analysis tabs), with nested tabs for each filtering set applied to that inheritance mode (Query tabs). Each query tab shows the number of SNVs and Indels identified.
You can switch between the tabs to revisit the results and also discard queries or analyses by clicking the X button on the tabs.
Variant Table Toolbar
The variant table has its own buttons set so you can do the following actions:
New Query: You can create new queries at any time by applying variant filters and using gene lists. The new query will be linked to the current inheritance mode in the Analysis tab.
Summary of results: Shows a visual summary of relevant information for the collected variants.
Plugins: A list of integrated plugins that can be used by taking the variants as input such as Varsomeapi (personal VarSome API token required) and Exomiser & Genomiser
Export: Allows you exporting a maximum of 1000 variants. It will download a .csv file to your local downloads folder.
View Applied Filters: You can check on the applied filters for the current query.
External Links and Databases
The following links provide additional resources and tools to enhance your analysis and understanding of the variants. Select a variant from the Results Table to view the available links.
- Links:
Frequent Links: dbSNP, gnomAD, ClinVar, VarSome, HGMD, USCS, OMIM, Franklin
Disease Information: OMIM, ClinVar, DisGENET, Edgar
Variant Information: dbSNP, Ensembl, NCBI, DGVa, GWASCentral, ClinVar, gnomAD, gnomAD Rare, UCSC, Franklin, VarSome, SpliceAI Lookup, Trap Score, Wintervar, LOVD
Gene Information: Ensembl, PubMed, Entrez, GeneCards, COSMIC, GTEx, gnomAD, GWAS Central, ATLAS, eDGAR, ClinGen, HGMD, GeneReviews, LOVD, genomeRNAi, DisGeNet
Pathway Information: Wikipathways
Data Discovery: GA4GH beacon, PubCaseFinder
Actionability: Treatabolome DB, IEMbase, ClinGen Knowledge Repo
ACMG guidelines: Varsome, Franklin, Wintervar
Pharmacogenomics: PharmGKB, PharmVar
- External Databases:
Pathways Reactome
HPSCreg
HmtDB - Human Mitochondrial Database
Results Table
The Results Table displays the variants that meet the applied filtering criteria and is slightly different depending on the analysis performed.
Case Analysis
Variants are grouped in two separate tables based on their type.
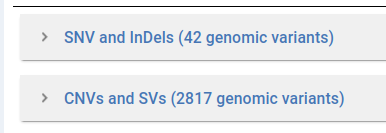
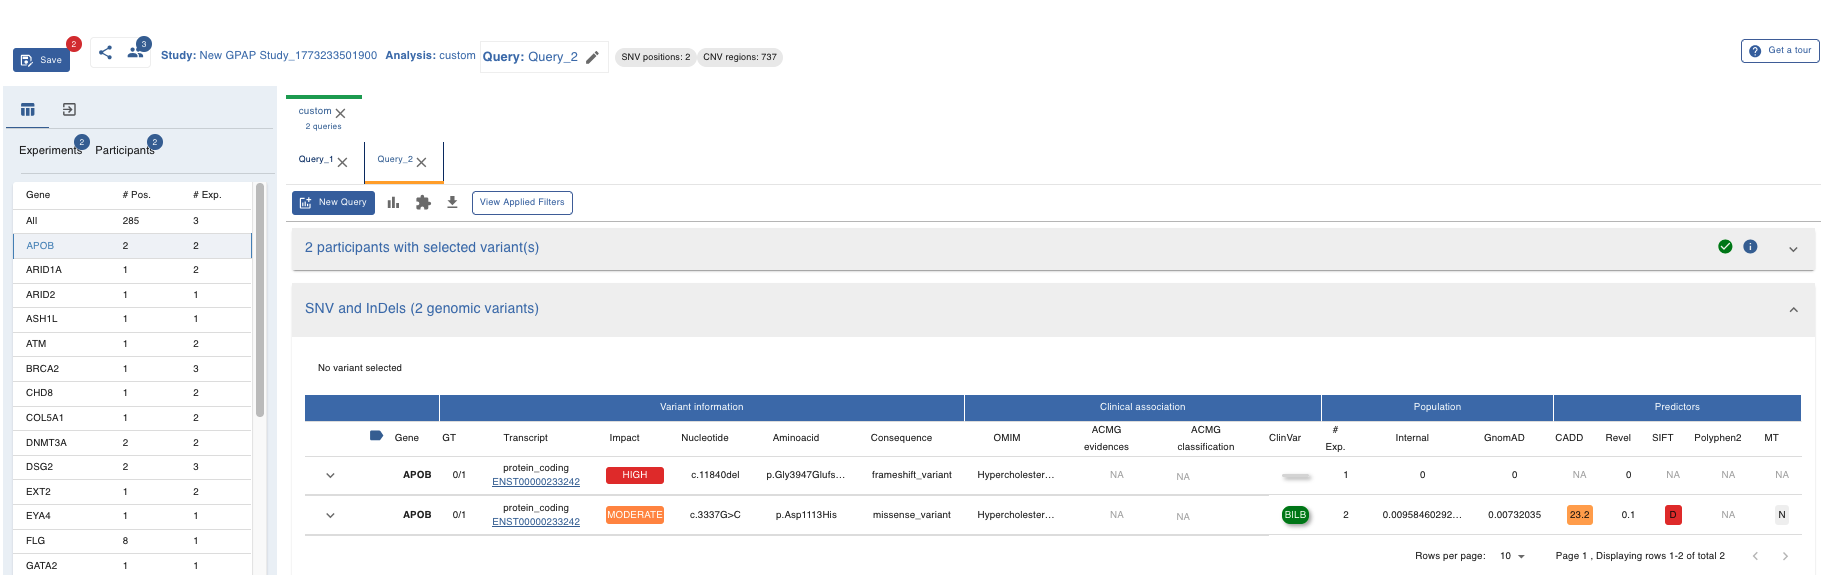
SNV and InDels Table
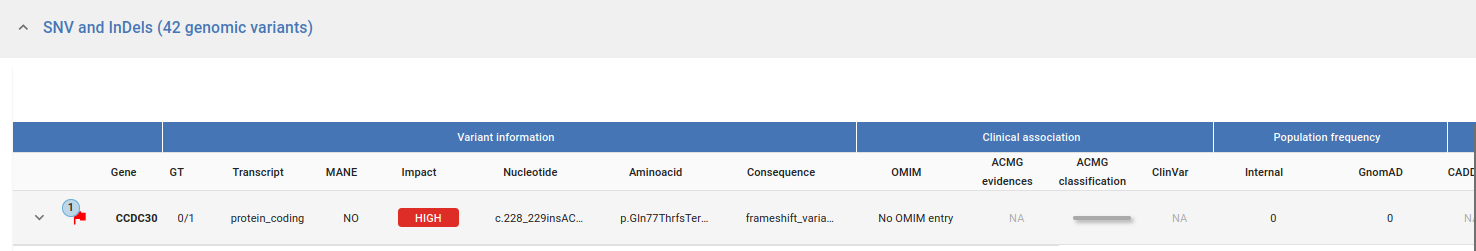
In the Variant table each row is a variant retrieved from the GPAP database. We provide information through the following fields:
Gene and Variant Info:
Gene Name
Genotype (GT)
Transcript BioType
MANE
Impact (as defined by Variant Effect Predictor (VEP))
Nucleotide Change
Aminoacid Change
Consequence (as defined by Variant Effect Predictor (VEP))
- Clinical Association:
OMIM
ACMG evidence (for SNVs only and based on InterVar)
ACMG classification (for SNVs only and based on InterVar)
ClinVar
- Population Info:
Internal Frequency
GnomAD AF
- Predictors:
CADD Predictor
Revel
SpliceAI
SIFT Pred
PolyPhen2 Hvar Predictor
Mutation Taster Predictor
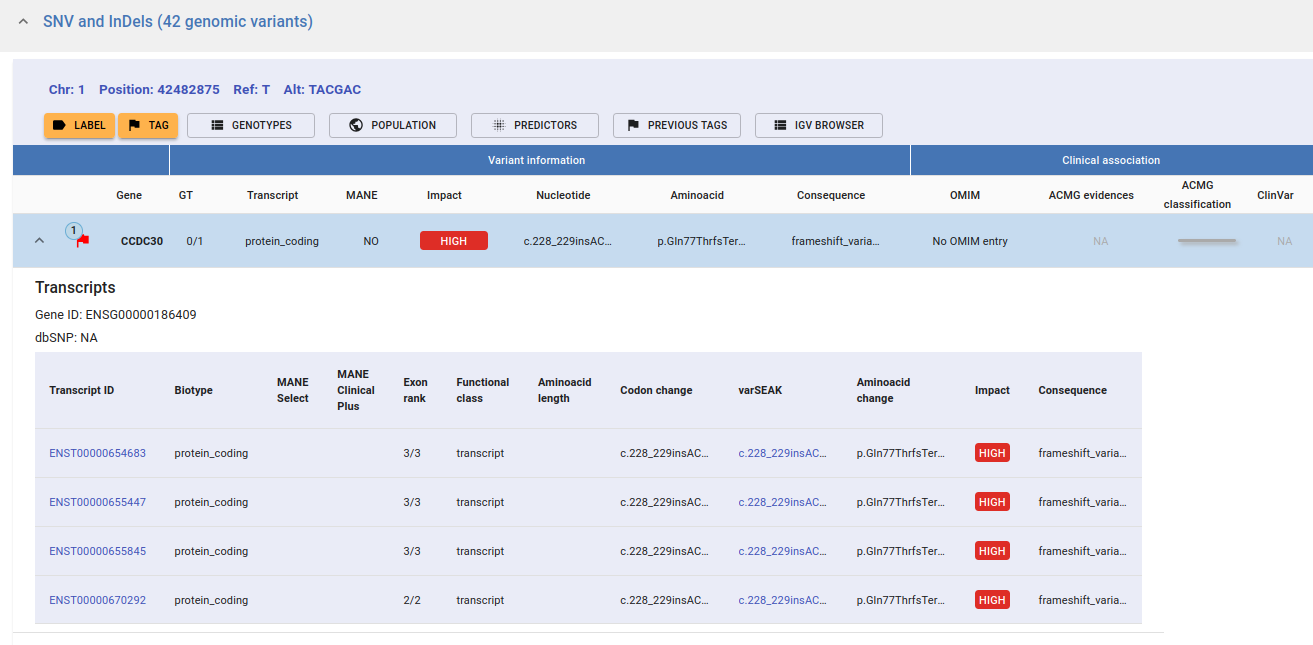
When selecting a variant, an extra toolbar with the following options appears (see image below):
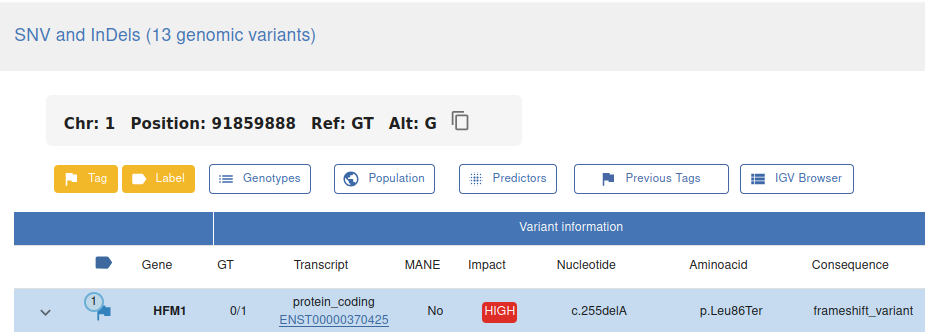
Tag (please refer to Label and Tag a variant section)
Label (please refer to Label and Tag a variant section)
Genotypes: genotype of the variant in all the study members
Population: allele frequencies by population
Predictors: detailed value of all pathogenicity predictors
Previous tags (please refer to Label and Tag a variant section)
IGV browser: visualise the variant at IGV within a 20bp or 1kbp window.
You can get further information by selecting a variant and expanding the Variant Row. The transcripts associated with the variant will be displayed. The main information of each transcript is shown in the image below.
CNV and SV Table
The CNV and SV variants are displayed in an interactive table. Every column is filterable and sortable in its header. Hovering over the column header provides additional details about the displayed information. You can swap between two existing views. The Complete View and the Split View, by using the following switch:
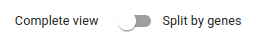
The Complete View shows the entire CNV or SV as detected by the caller while the Split by genes View breaks down each variant into its constituent genes displaying one gene per row.
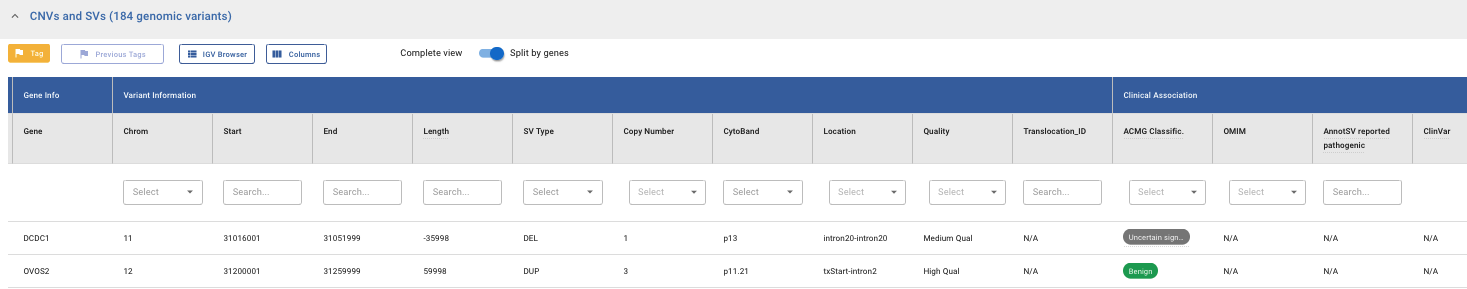
The sections and fields in the table are the following:
- Gene and Variant Info:
Gene Name
Chromosome
Start
End
Length
SV type
Copy Number
Cytoband
Location: only in split view.
Quality (see Data quality section).
Translocation_ID: groups the variants belonging to the same translocation.
Clinical Association:
ACMG Classification
OMIM: only in split view.
AnnotSV reported pathogenic
ClinVar (see ClinVar section).
Population Frequency:
AnnotSV population AFMax
Internal Frequency
Internal Frequency Count: number of times a CNV / SV has been detected in our internal database (see Internal Frequency section).
Exact match
Additional Information
Tool
Experiment ID
When selecting a variant, an extra toolbar with the following options appears (see image below):
Label (refer to Label and Tag a variant section).
Tag (refer to Label and Tag a variant section).
Previous tags (refer to Label and Tag a variant section).
IGV browser: visualise the variant at IGV within a 20bp or 1kbp window (see IGV browser section).
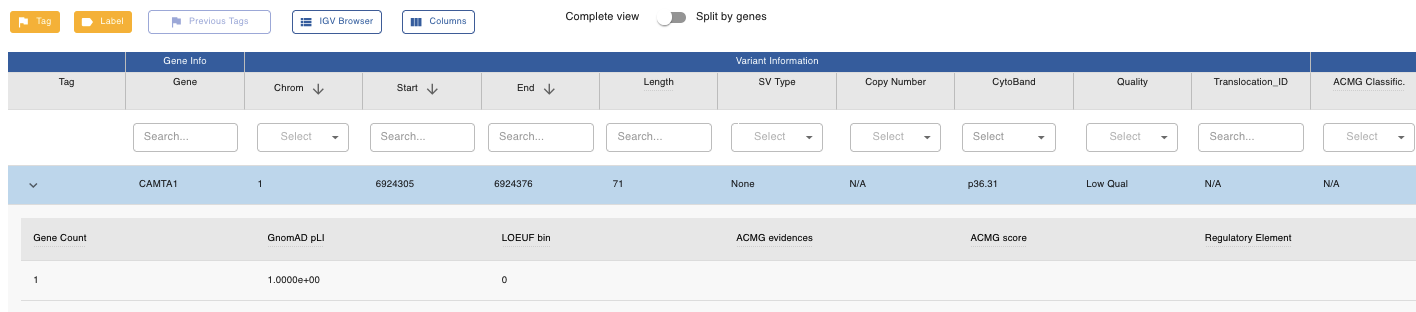
You can get further information on a variant by clicking on the expand icon as seen in the image below.
Cohort Analysis and Search Across All Experiments
The Cohort Analysis and Search Across All Experiments functionalities display results through the following tables:
Participants table: lists all participants who have variants that meet the filtering criteria.
SNV and InDels table
CNV and SV table
Gene summary table (left panel): Displays the number of patients, SNV/InDels, and CNV/SV that meet the filtering criteria, both in total (first row) and by queried gene (remaining rows).
Results can be analyzed using two approaches:
Participant by participant
Gene by gene
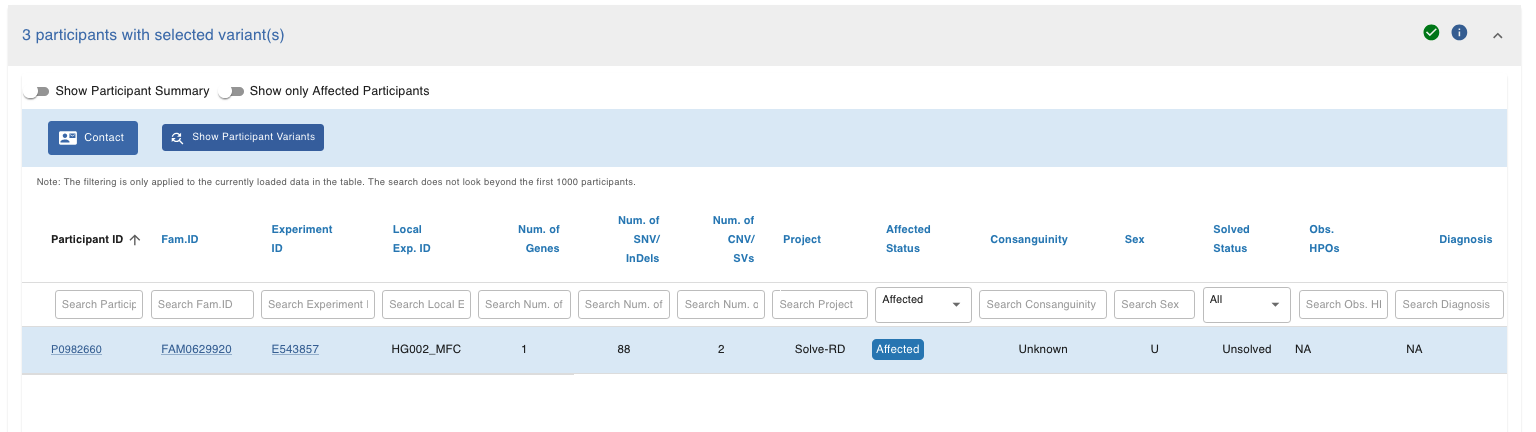
Participant by participant
From the Participants table, the list of participants can be refined by applying filters to the fields in the column headers (e.g., selecting unaffected and/or unsolved patients, filtering by a particular HPO term or diagnosis, etc.).
Once the list of participants to analyze has been defined, select a participant and click Show Participant Variants. The SNV/InDels and CNV/SV tables will automatically update to display the variants for the selected participant.
Gene by gene
From the gene summary table on the left, select a gene. The Participants, SNV/InDels, and CNV/SV tables will automatically update to display the participants and variants that meet the filtering criteria for the selected gene.
The SNV/InDels and CNV/SV tables contain the same fields as those shown in Case Analysis (see the Case Analysis Results Table section).
Additional information about SNV/InDels and CNV/SV variants can be accessed by selecting a variant and clicking the external links icon (see image below), which provides access to relevant external resources (see the External Links and Databases section in Variant Dashboard).
IGV browser
GPAP includes an embedded IGV (Integrative Genomics Viewer) browser for visualizing genomic data. To visualize a specific variant:
Select the variant in the table.
Click the IGV Browser button.
Choose either a 20 bp or 1 kbp window size.
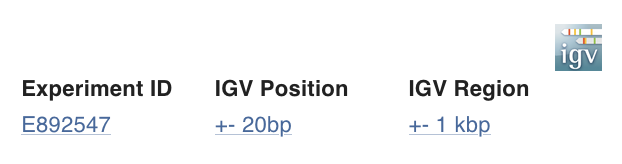
This will automatically open a new browser tab at the exact position or region selected.
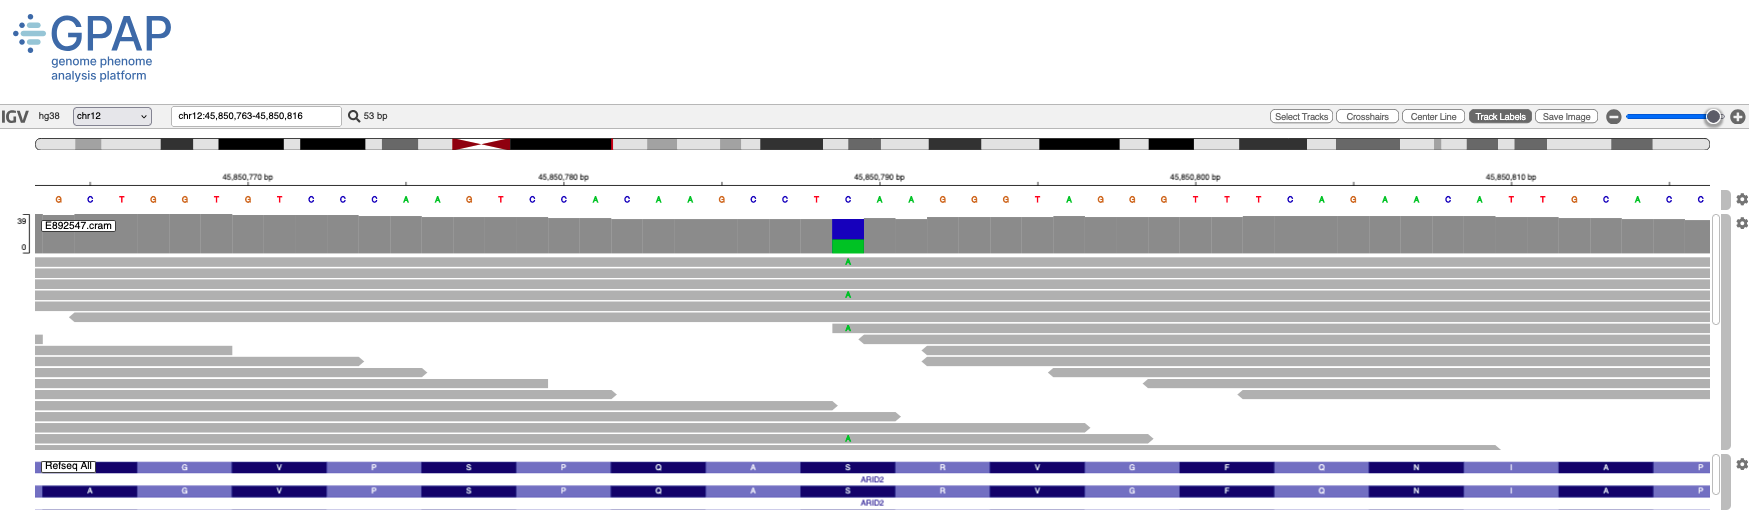
You can navigate to another location by selecting any chromosome and, optionally, specifying a position or range. To visualize more than one experiment, click on the corresponding samples. Each experiment will open in a separate tab.
For a complete list of features and detailed instructions, refer to the official IGV web browser documentation: https://igvteam.github.io/igv-webapp/
Label and Tag a variant
When selecting a variant, two options to highlight variants are provided: Label and Tagg. Their behavior is slightly different, you can Tag a variant with a Label but you can’t label an already tagged variant.
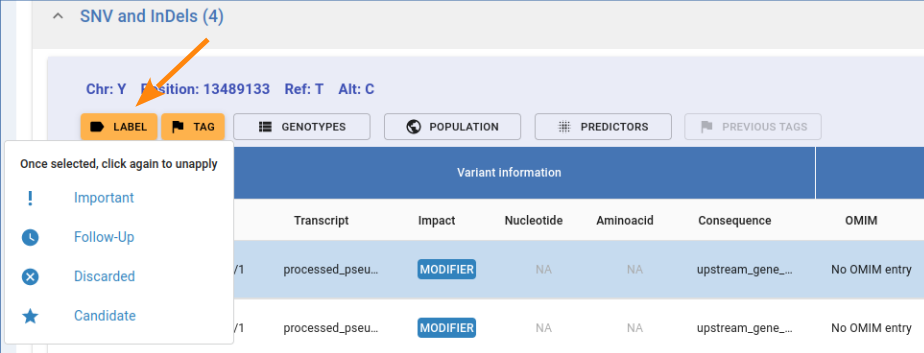
Labeling
Labeling a variant is a personal annotation that will not be shared beyond the current query. By clicking on the Label button as shown in the image below, you can pick between four different labels: Important, Follow-up, Discarded and Candidate, each with its own symbol.
Tagging
Tagging is stored within the GPAP and applies to all experiments with the tagged variant, making it visible to all GPAP users. It is indicated with a flag next to the gene name.
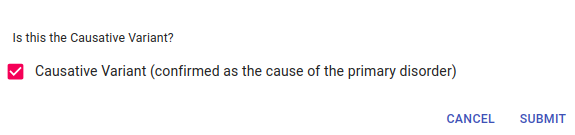
To tag a variant select the variant in the table and click on the tag button. The dialog in the image below will appear, fill in the different fields and indicate if this is a causative variant.
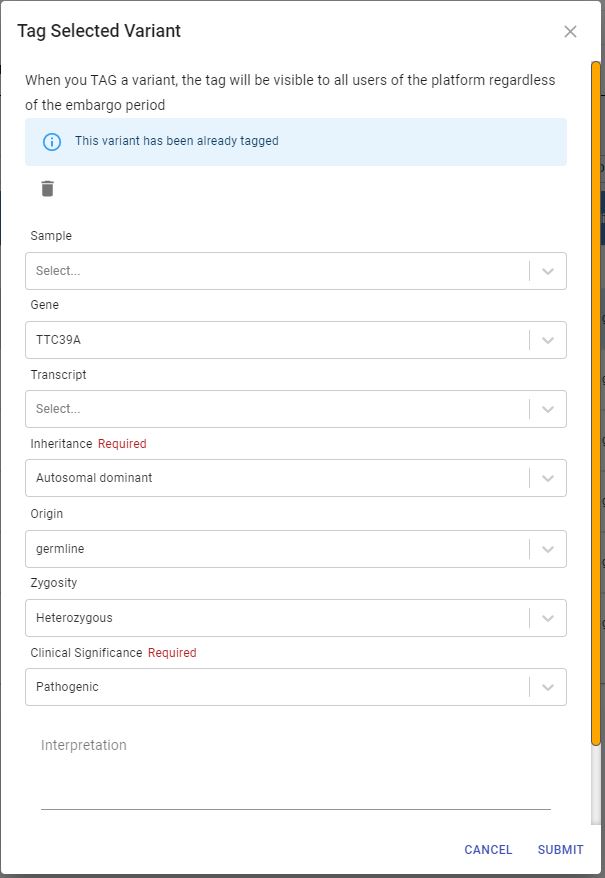
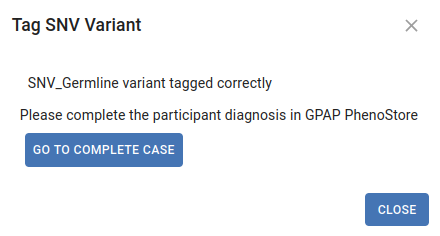
Once the tag is submitted, this dialog will be displayed:
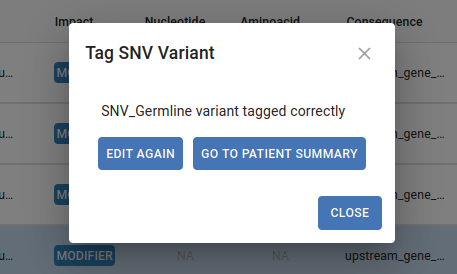
Click Go to patient summary to access PhenoStore and edit the case information. If the Causative checkbox is selected and you are the owner of the case, you will be requested to update the Participant’s Solved Status.
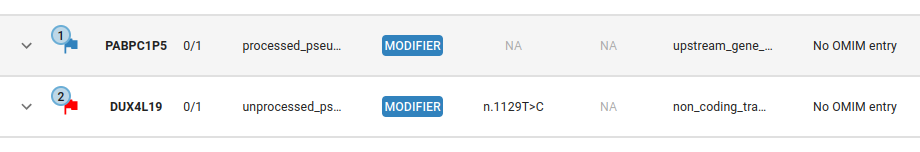
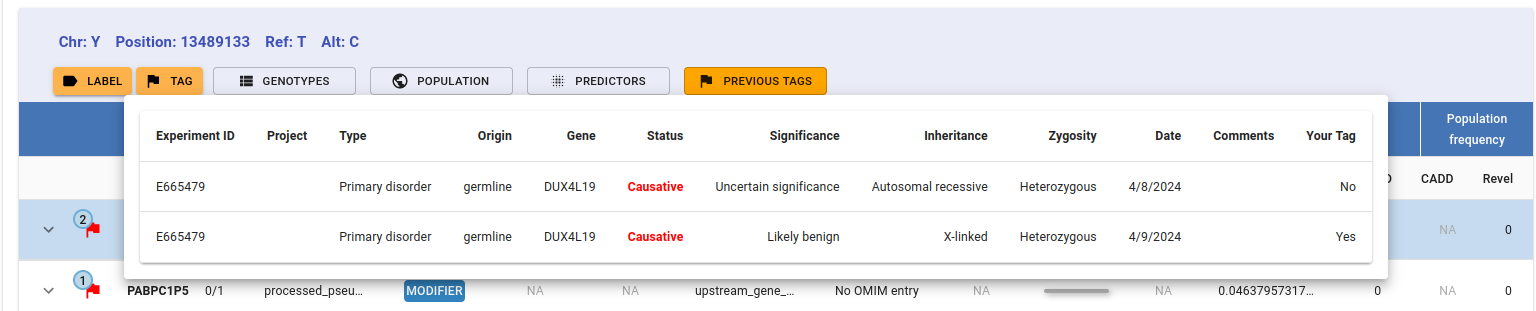
Listing all tags for a variant
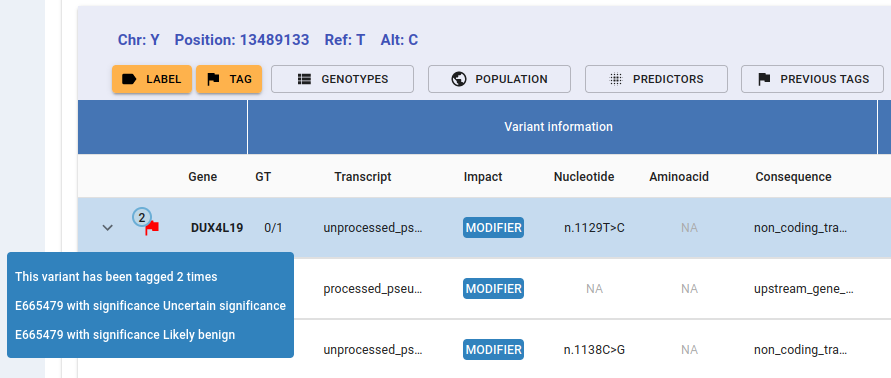
A number in the upper-left corner of the tag flag tells you how many times this variant has been tagged. If you hover the mouse pointer over the flag, a tooltip details the sample code and the clinical significance/s of each tagg.
If you still need further details on the other users’ tags, click on the Previous Tags button and a detailed list will unfold:
Save, share and delete a study
You can save a study at any time by clicking in the corresponding button in the Study Toolbar on the Variant Dashboard, setting a name, adding a description, and selecting its visibility:
Public: study visible to all users
Share with groups: study visible only to users within your GPAP groups
Private: Study visible only to you
Once saved, the study can be saved over again to store new queries or update information like its name, description, and visibility.
Warning
Deleting queries and analyses is irreversible and takes effect immediately. No saving is required.
After saving, you can share the study using the link generated in the sharing options.
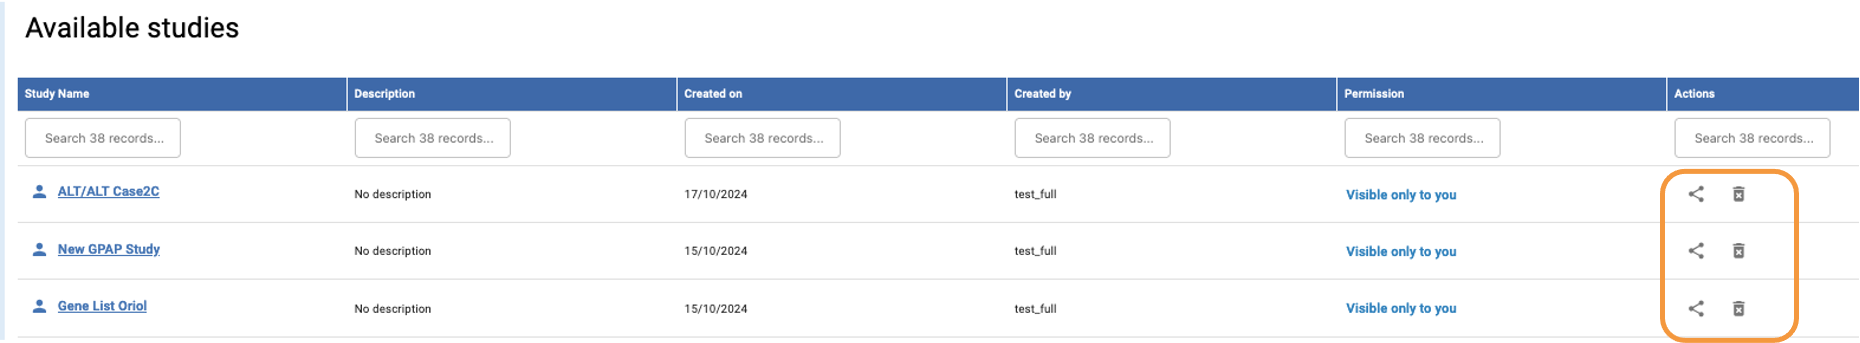
From the Genomics homepage, you can share and delete your studies by clicking the share or trash bin icons, respectively, in the Actions column of the Available Studies table.
CNV/SV analysis
This section provides an overview of the CNV and SV analyses conducted for each GPAP instance, highlighting the tools used, key considerations, and their implications for interpreting CNV and SV results.
Note
SVs that fail the quality check are not uploaded to the GPAP.
A maximum of 10,000 CNVs + SVs per individual are displayed. If more than 10,000 meet the filtering criteria, only the first 10,000, sorted by chromosomal order, will be shown.
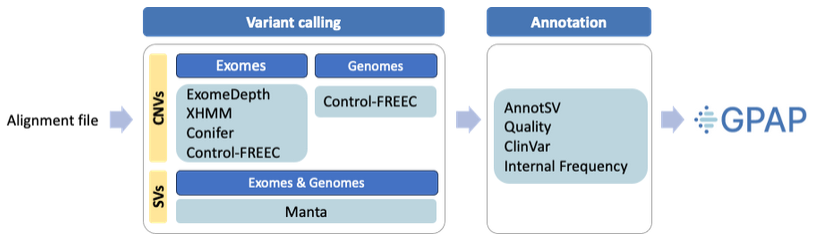
Workflow CNAG portal GPAP
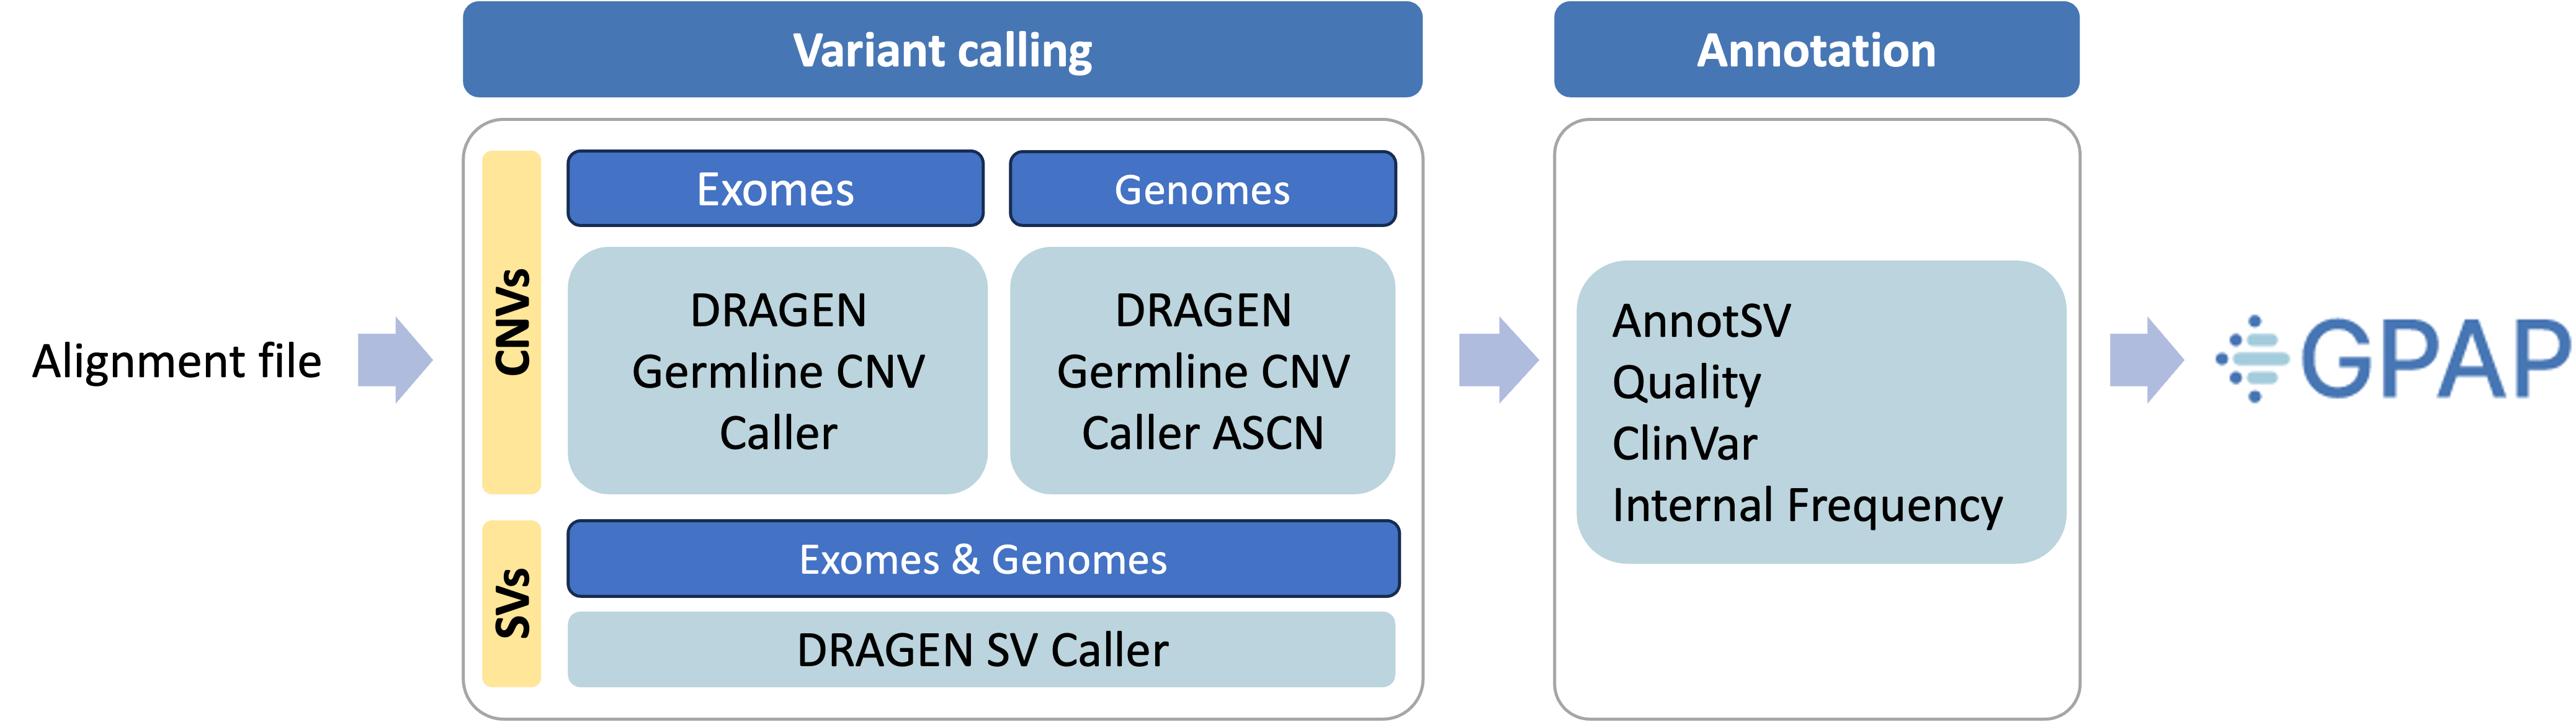
Workflow RD-Connect GPAP
Variant calling tools
ExomeDepth, XHMM and Conifer: used specifically for CNV detection in exomes. A minimum of 10 individuals sequenced with the same kit are needed for conducting the CNV analysis. To enhance performance and mitigate technical noise, all available individuals sequenced with the same kit are analyzed collectively.
Control-FREEC: for calling CNVs from both exomes and genomes. A sliding window size of 20000bp is considered by comparing each individual to a baseline generated from a minimum of 50 sex-matched individuals sequenced under the same conditions.
Manta: used for SV calling in both exomes and genomes. Detected variant classes include deletions, insertions (fully and partially assembled), inversions, tandem duplications and interchromosomal translocations. It’s based on paired and split-read evidence, although it does not require split-reads or successful breakpoint assemblies to report a variant in cases with strong evidence.
DRAGEN Germline CNV Caller: detects duplications and deletions by comparing the normalised read depth of each sample against a normalised read depth of a Panel Of Normals (PON). The PON ideally consists of 100 individuals (minimum 50 individuals) sequenced with the same kit. For exome kits with less than 50 samples, CNV calling is not performed.
DRAGEN Germline CNV Caller Allele-Specific Copy Numbe (ASCN): leverages depth of coverage and B-allele frequencies to detect germline copy number aberration and regions with absence of heterozygosity. A catalog of population SNPs is used to estimate the B-allele frequencies across the genome.
DRAGEN SV Caller: detects large genomic alterations such as deletions, duplications, insertions, inversions, and translocations from sequencing data. It’s based on paired-end read alignments, split reads, and read depth evidence, although it does not require split-reads or successful breakpoint assemblies to report a variant in cases where there is strong evidence otherwise.
Annotation
AnnotSV is used to annotate and harmonize the outputs of all the CNV/SV callers. This tool provides functional, regulatory and clinical annotations for CNV/SV interpretation. The most relevant annotations will be displayed in the GPAP main results table.
Data quality
The following quality parameters are considered for each CNV/SV caller:
Category |
CNV/SV caller |
Quality parameter |
|---|---|---|
CNVs |
ExomeDepth |
Bayes Factor |
Correlation Coefficient |
||
XHMM |
Q_SOME |
|
Q_NON_DIPLOID |
||
Conifer |
Standard deviation |
|
Control-FREEC |
Wilcoxon P-value |
|
Kolmogorov-Smirnov P-value |
||
DRAGEN CNV |
Filter |
|
SVs |
Manta |
Phred score (QUAL) |
Filter |
||
DRAGEN SV Caller |
Filter |
For ExomeDepth, XHMM, Conifer and Control-FreeC, CNVs are ranked based on the parameters outlined in the Table above. In tools where multiple quality parameters are available, each one is individually ranked before being combined. Then, CNVs are categorized into quartiles as follows:
HIGH confidence: CNVs in the first quartile
MEDIUM confidence: CNVs in the second and third quartile
LOW confidence: CNVs in the fourth quartile
For Manta SVs, those with the highest quality (Phred Score = 999 and Filter = PASS) are classified as HIGH confidence. The remaining SVs are ranked based on Phred score and Filter parameters and classified into quartiles following the CNVs approach. It is important to note that the employed CNV/SV callers do not propose specific thresholds to distinguish genuine CNVs/SVs from false positives. Our quartile classification approach is meant to be a guide for CNV/SV interpretation.
For DRAGEN CNV and SV callers, all the variants with Filter = PASS are uploaded to the GPAP.
ClinVar
CNV/SV data is annotated with ClinVar considering 2 different overlaps depending on the clinical significance of the ClinVar feature (based on AnnotSV guidelines):
Features overlapping the test variant: at least 70% of the test variant overlaps with a benign or likely benign feature in ClinVar.
Features overlapped with the test variant: at least 70% of the ClinVar NOT benign and NOT likely benign feature overlaps with the test CNV.
ClinVar annotation is limited to variants with precise genomic location and mapped to the GRCh37 and/or GRCh38 genome assembly. Variants with imprecise start and stop, such as CNVs detected by microarray or translocations are not included in ClinVar’s VCF files and therefore can’t be annotated.
Internal Frequency
Internal frequency of each CNV/SV in our in-house database is computed considering that two events are the same if:
They are the same CNV/ SV type
They have at least 70% reciprocal overlap

For translocations:
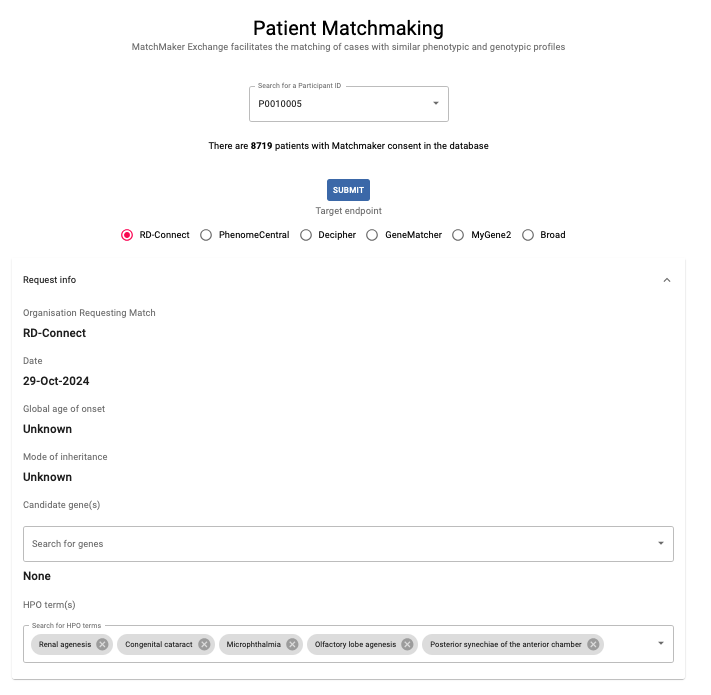
Patient Matchmaking
Click on the Patient Matchmaking button in the Genomic Analysis dashboard to use MatchMaker Exchange (MME) to find patients with similar phenotypic and genotypic profiles in other databases.
Search for the PhenoStore ID of your patient of interest in the dropdown list; all patients with Matchmaker consent are included. To submit the Matchmaker request, choose a database and complete the candidate gene(s) and HPOs if needed (note that the patient HPOs are imported from PhenoStore).
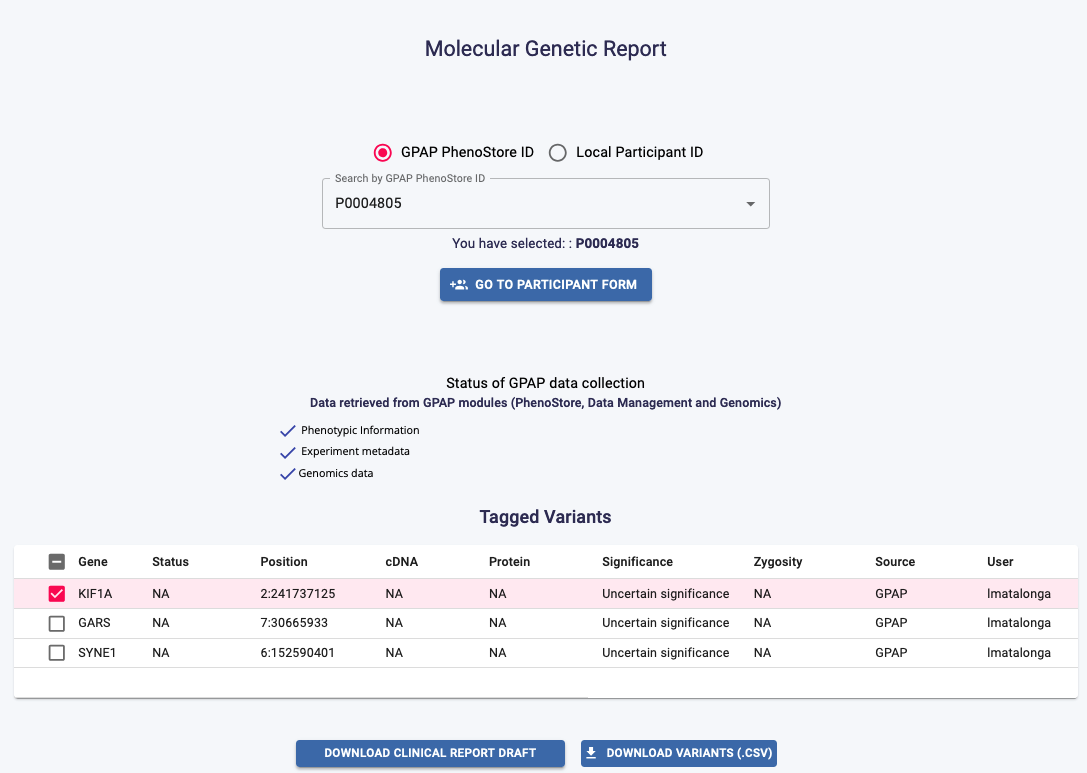
Clinical Report
Click on the Clinical Report button in the Genomic Analysis dashboard to create and export a draft of a clinical report.
Search for the PhenoStore ID or Local Participant ID in the dropdown list. Phenotypic information, experiment metadata and genomics data will be retrived from the corresponding GPAP modules. Select the tagged variants you want to include and choose to either Download a Clinical Report Draft or to Download Variants (.CSV).